US-China Trade War Graphics
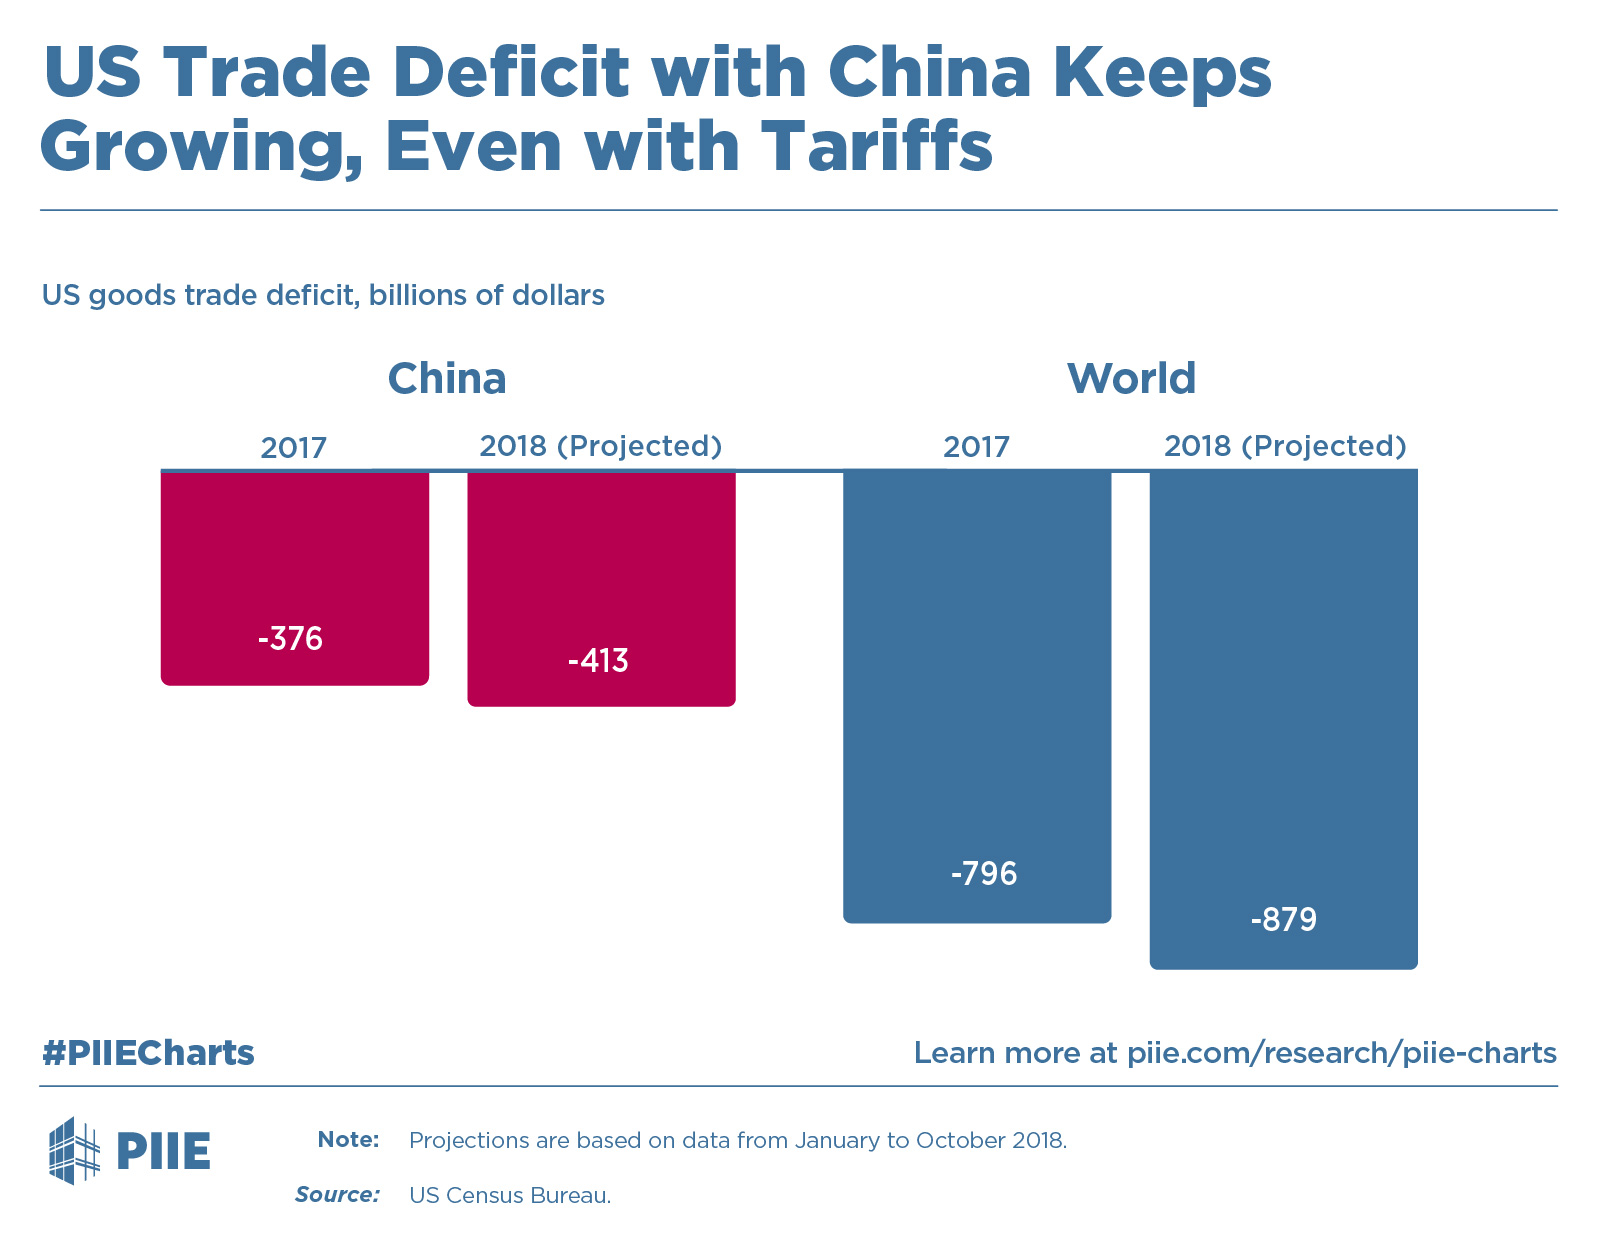
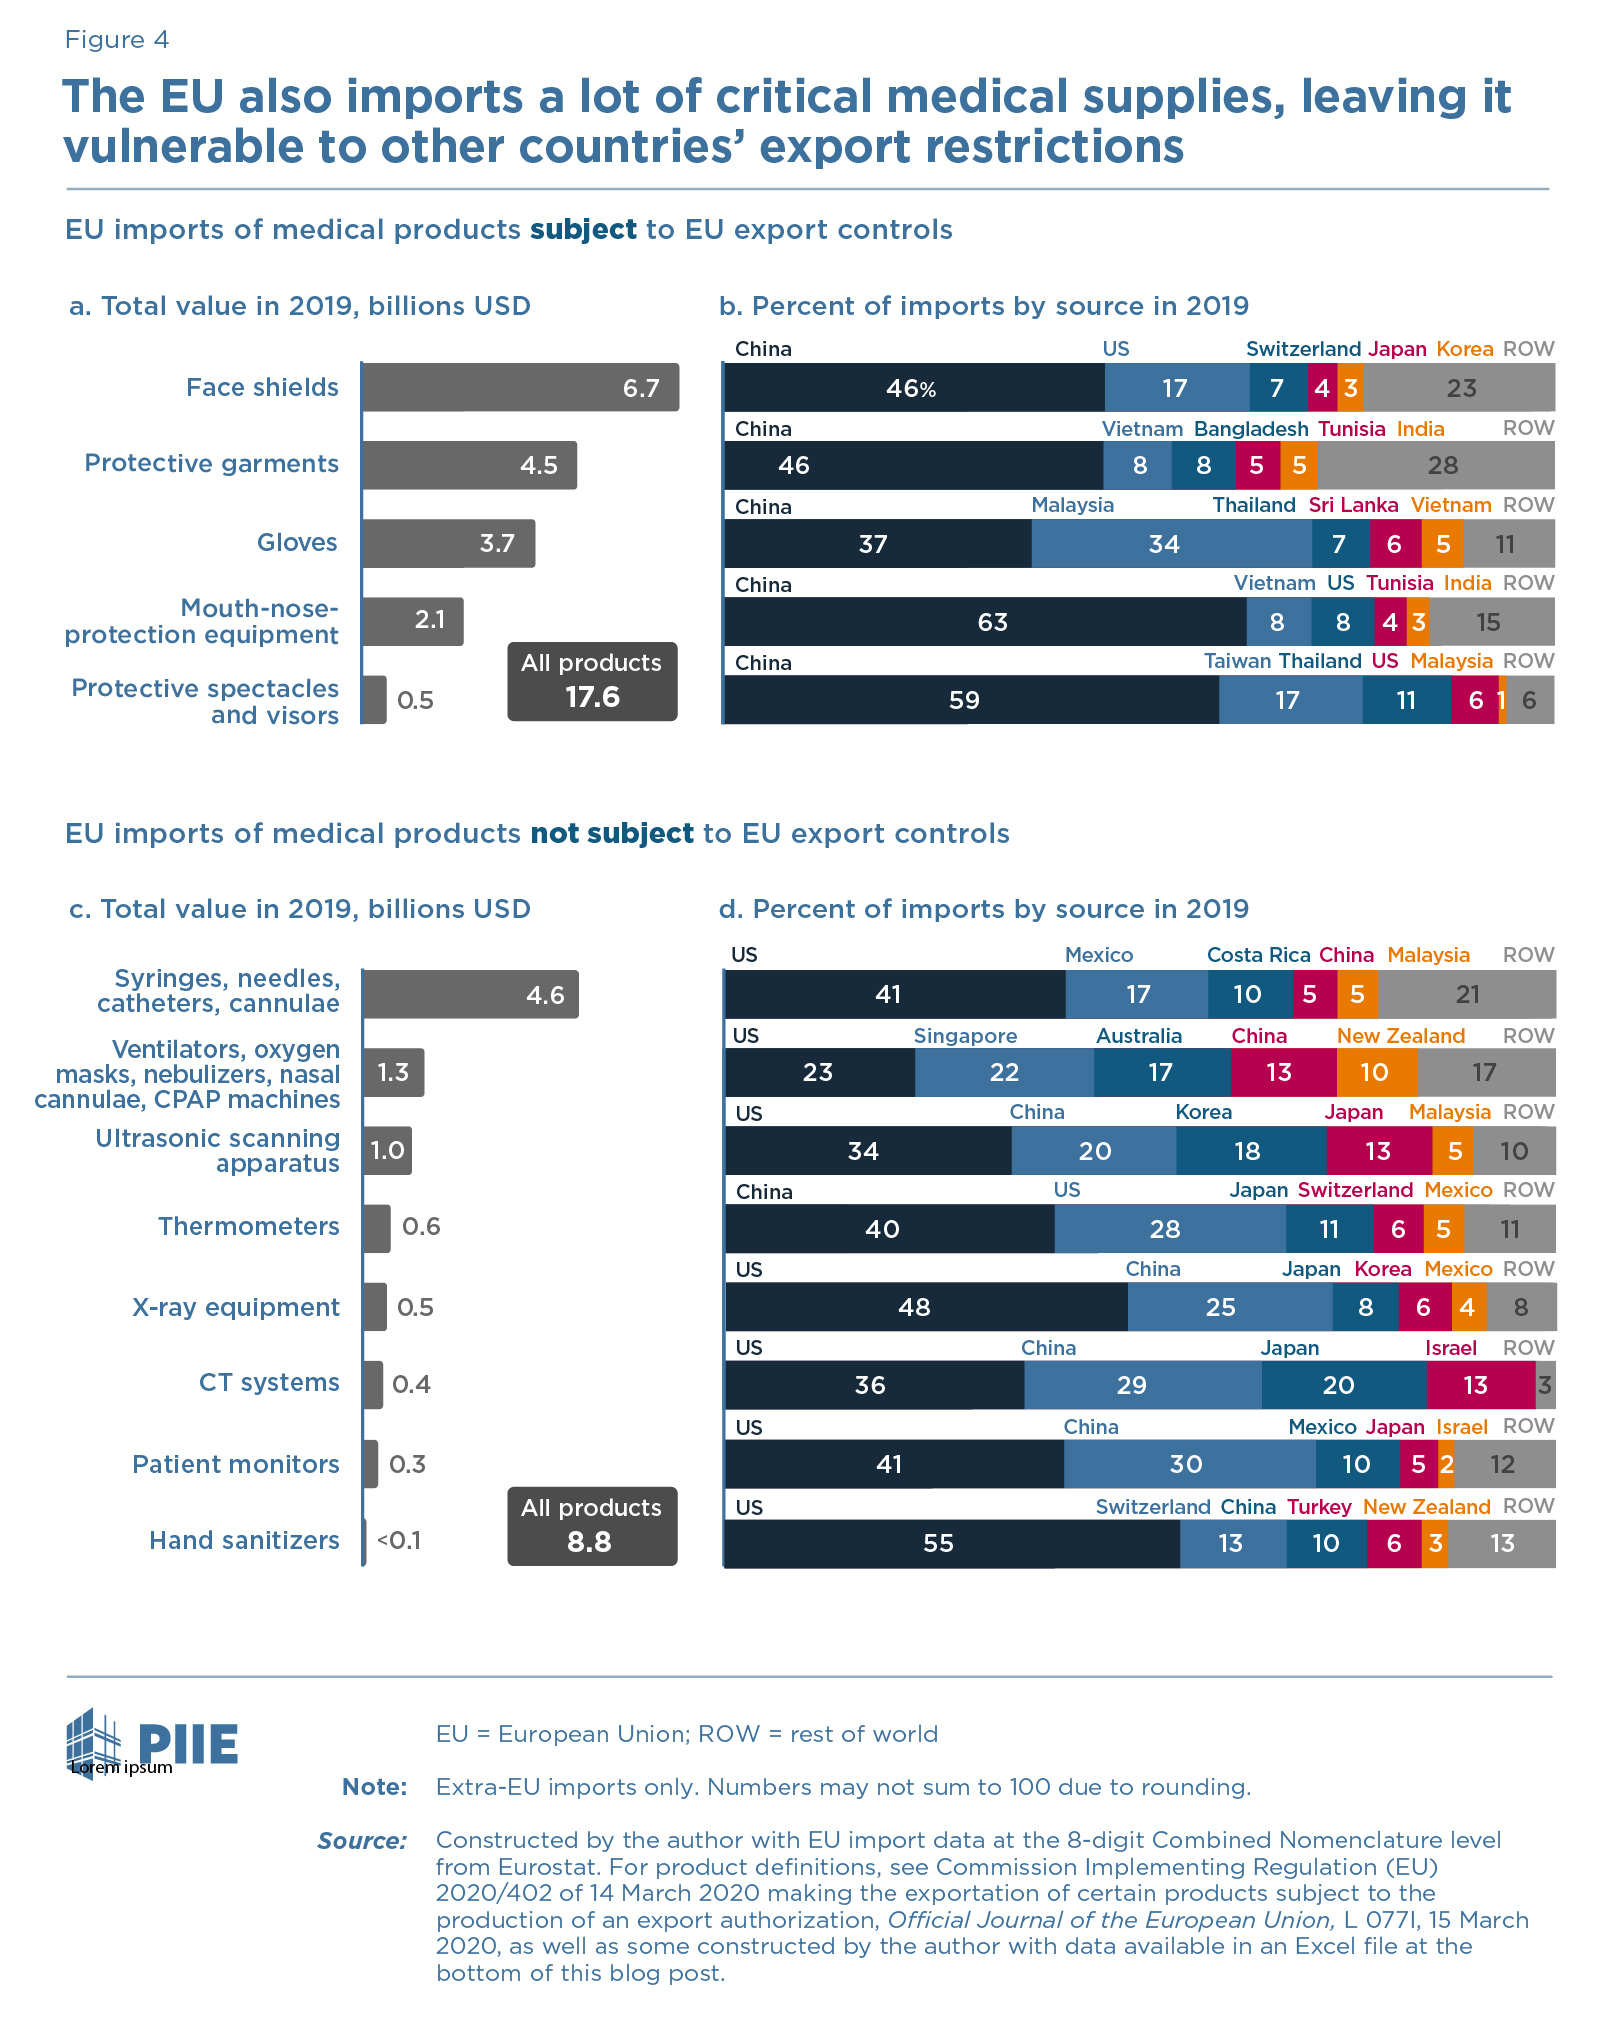
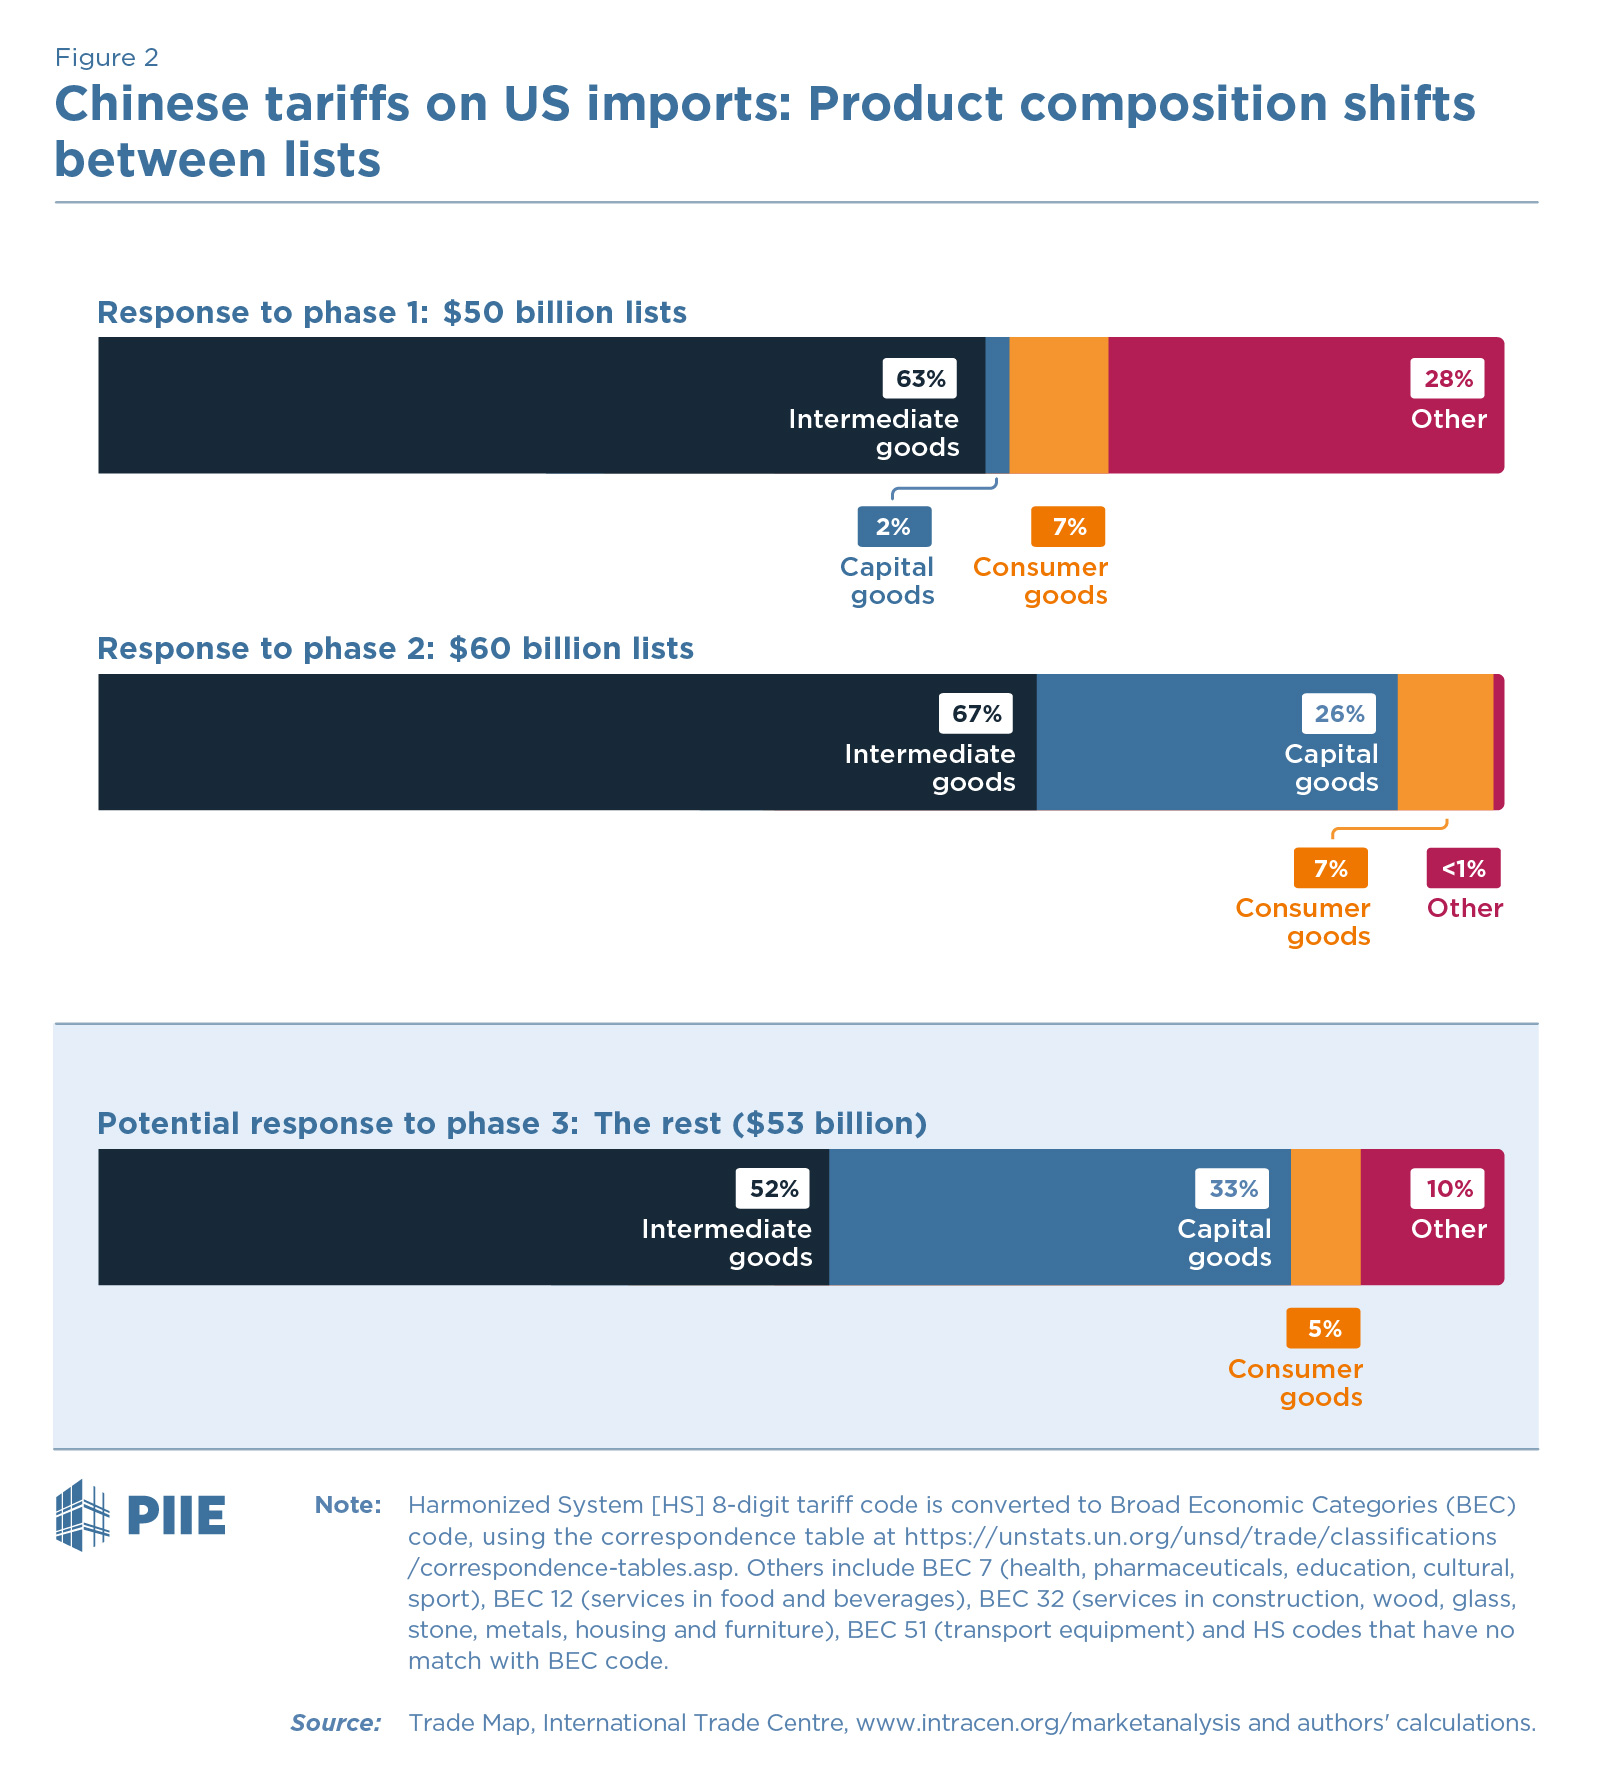
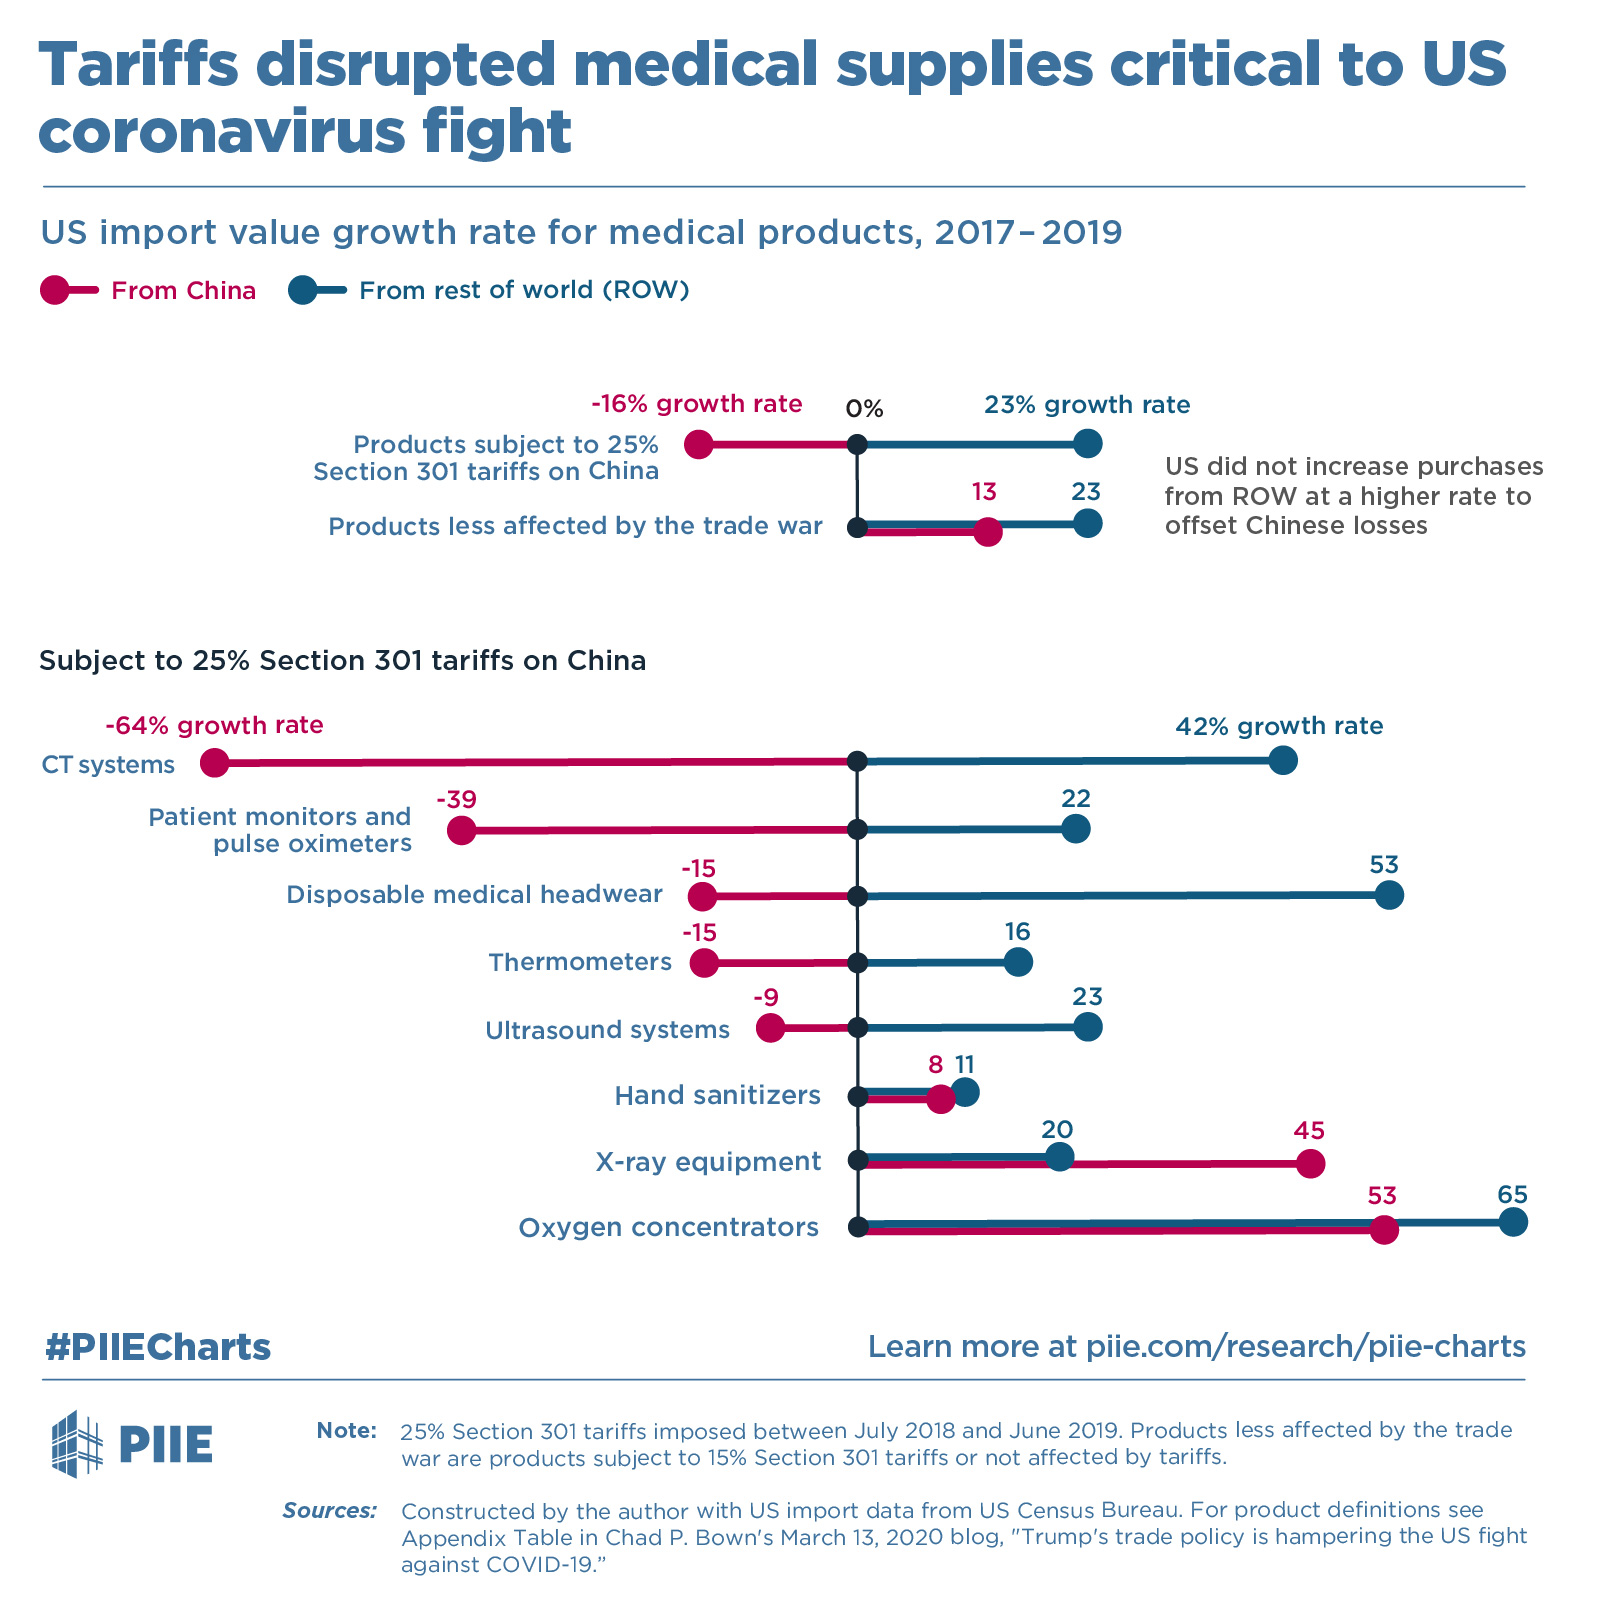
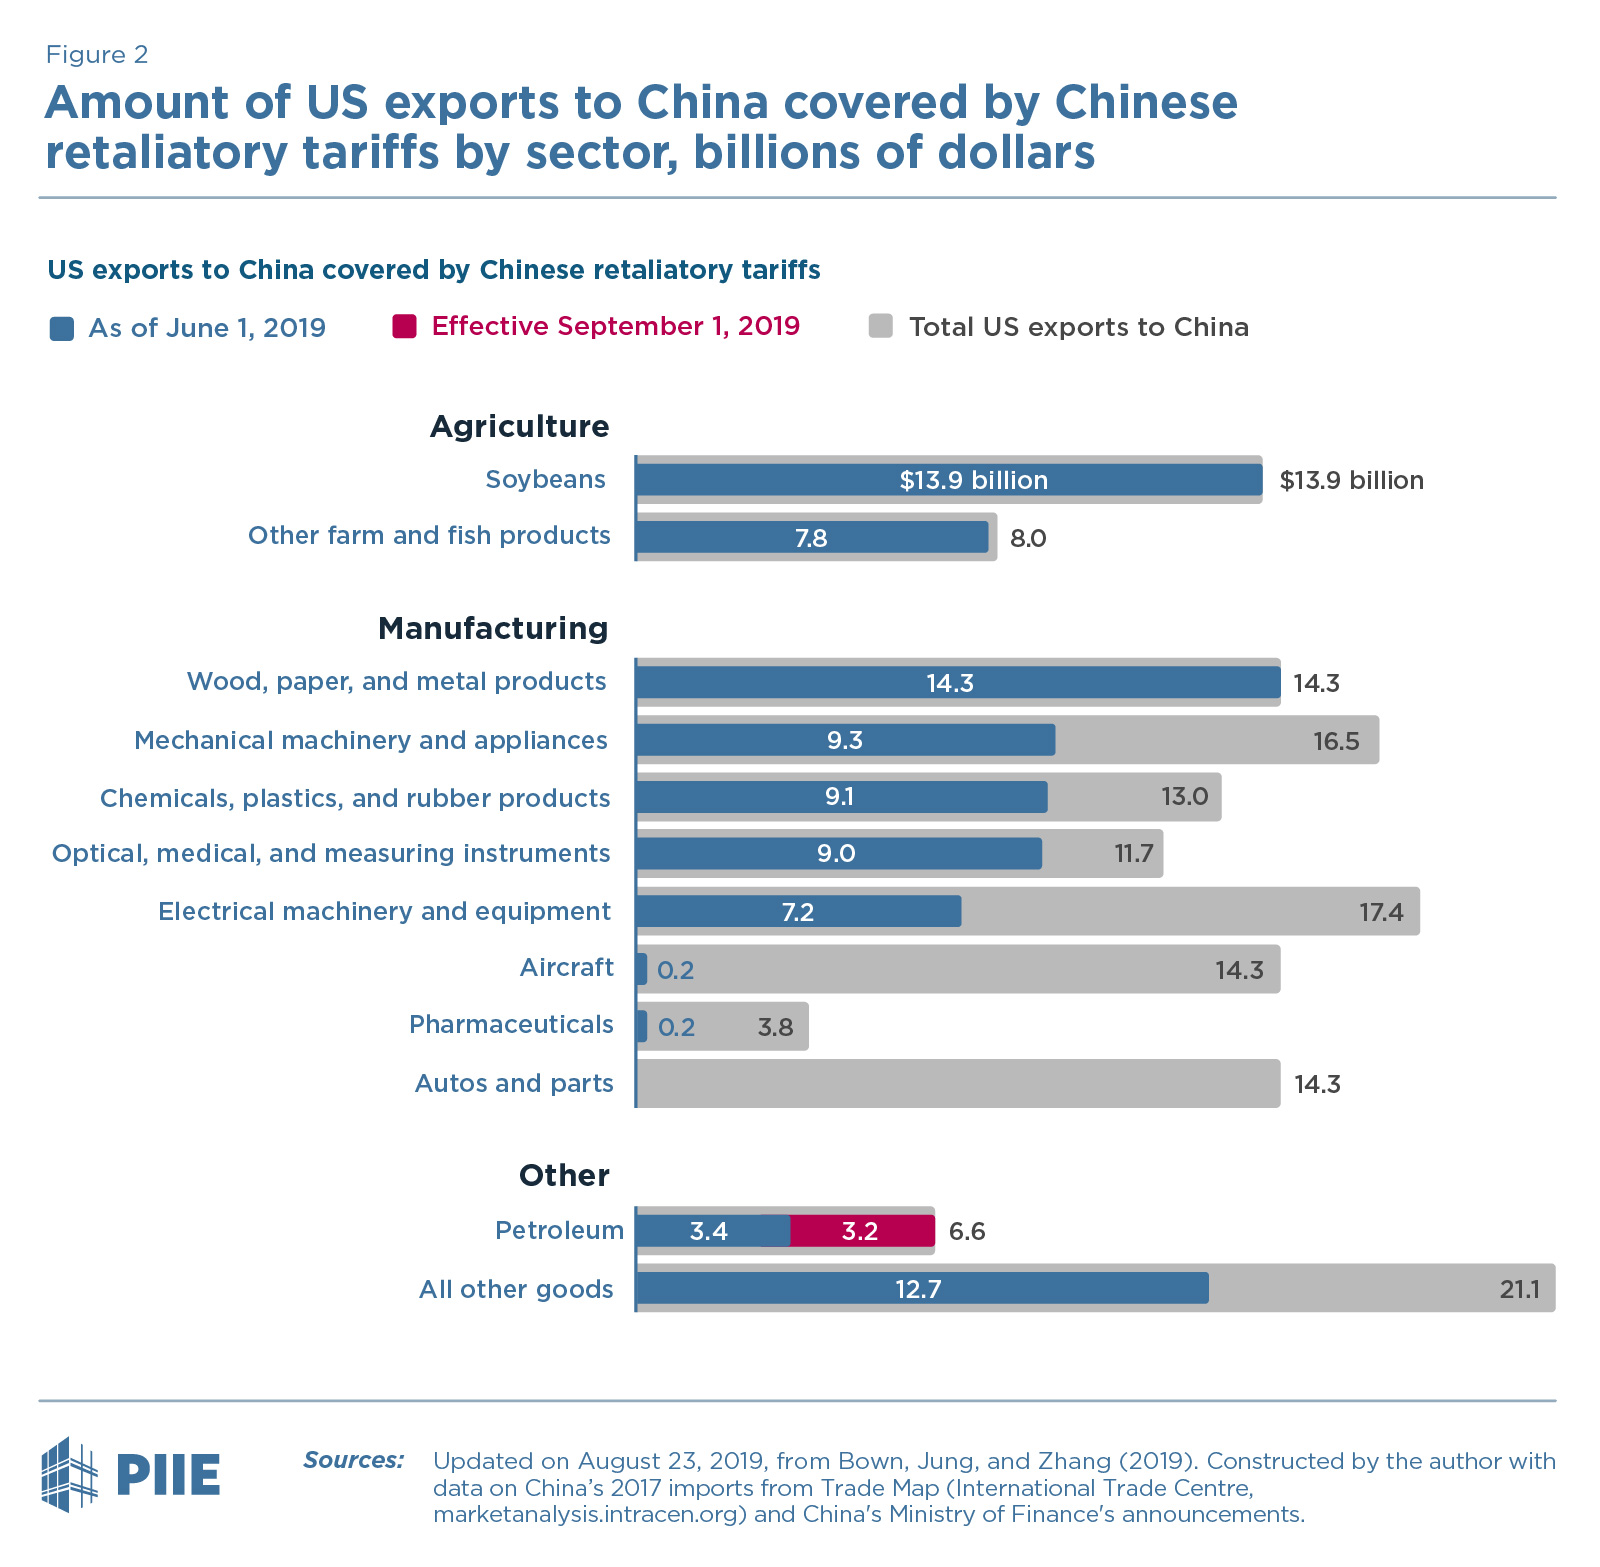
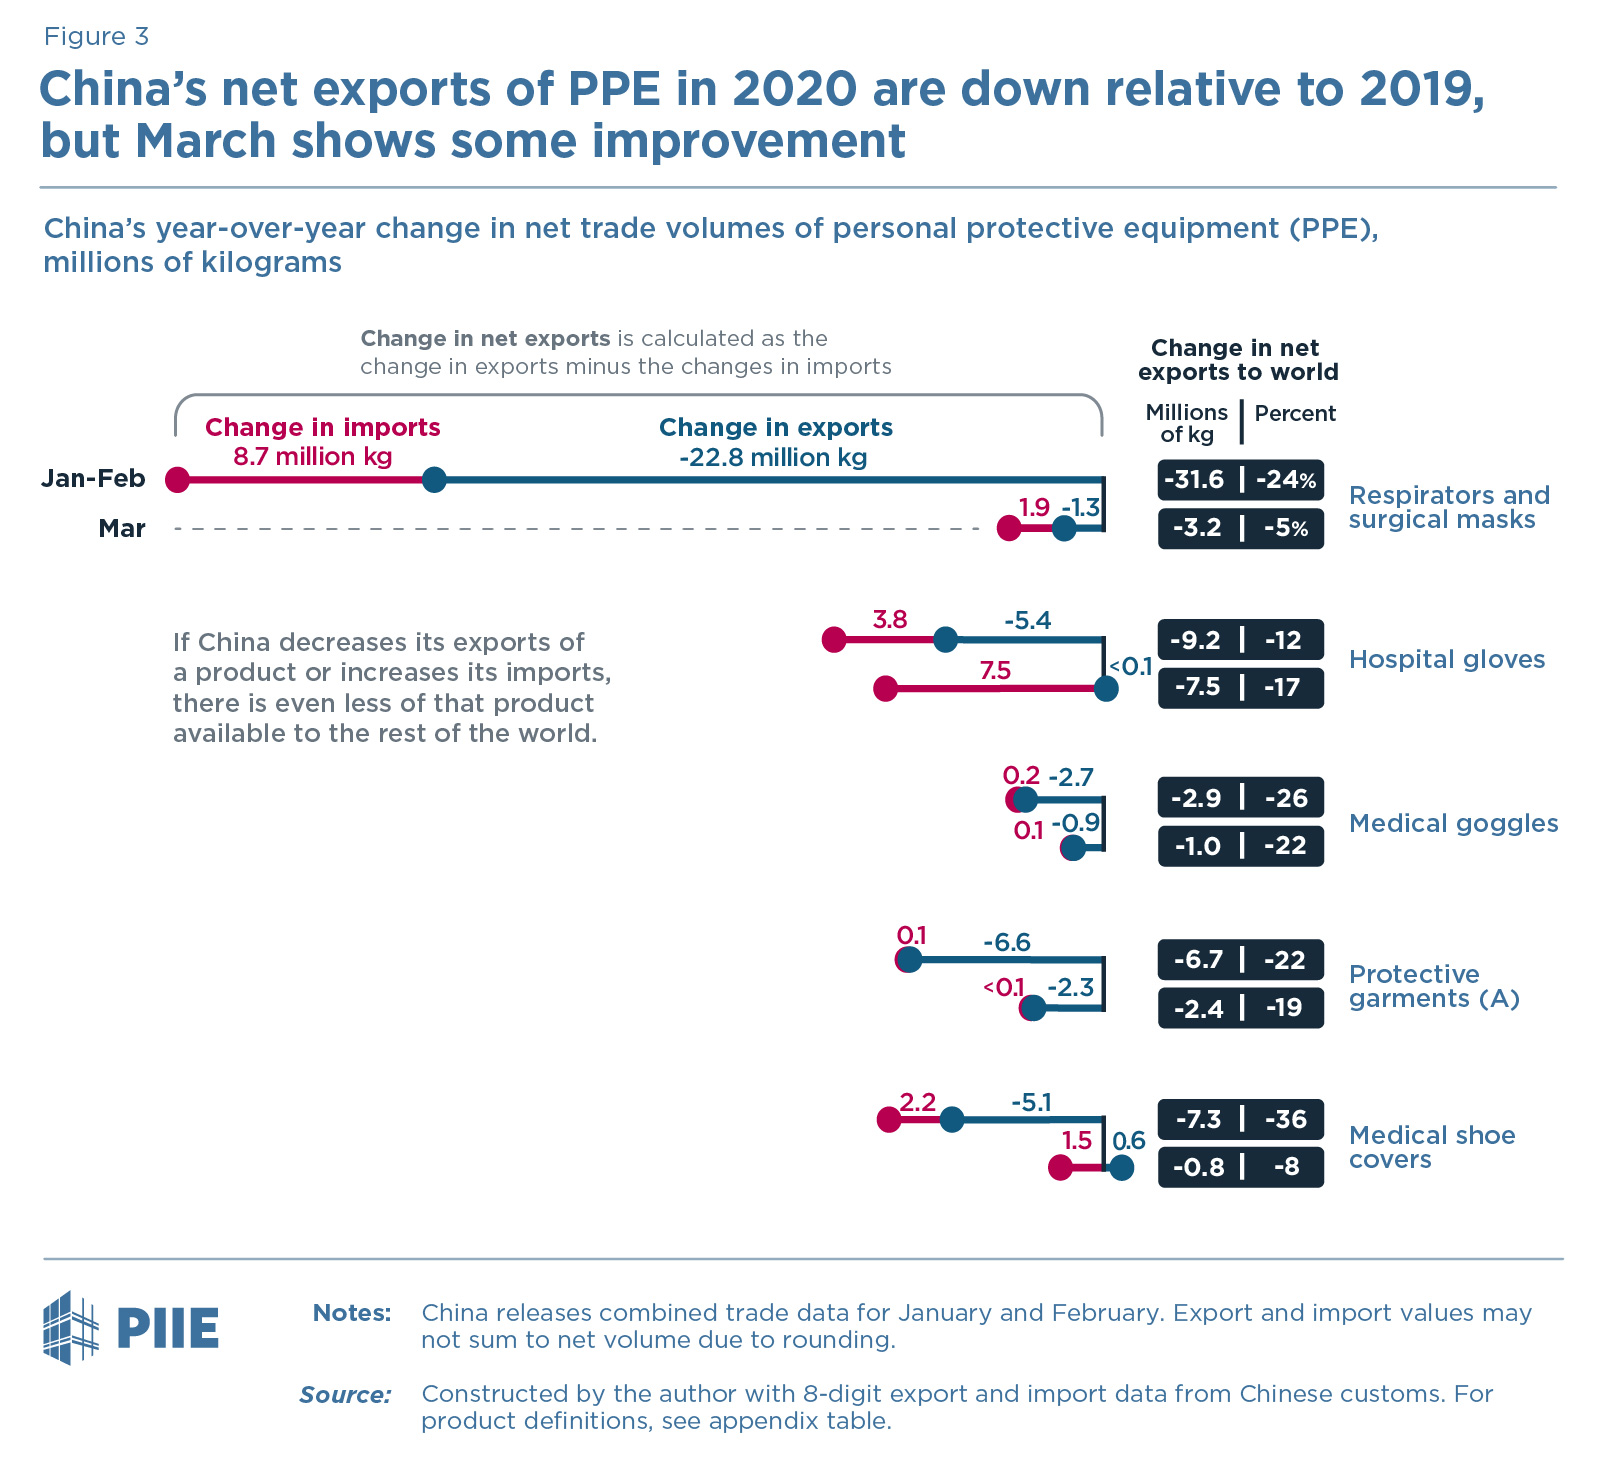
The US-China trade war was one of the biggest, if not the biggest, economic endeavor of the Trump Administration. The trade conflict produced a torrent of dubious information and kept a small army of analysts busy trying to quantify the consequences of tariff escalation. The trade experts at the Peterson Institute were no exception to this, and PIIE's coverage of the trade war remains some of the best research available on the topic. PIIE's leading trade economist, Chad Bown, produced much of this research, and was particularly open to working with our communications team on graphics and charts to help explain the trade war. This gave me an outstanding opportunity to support high level research and provide much need clarity on some very complicated economic issues.
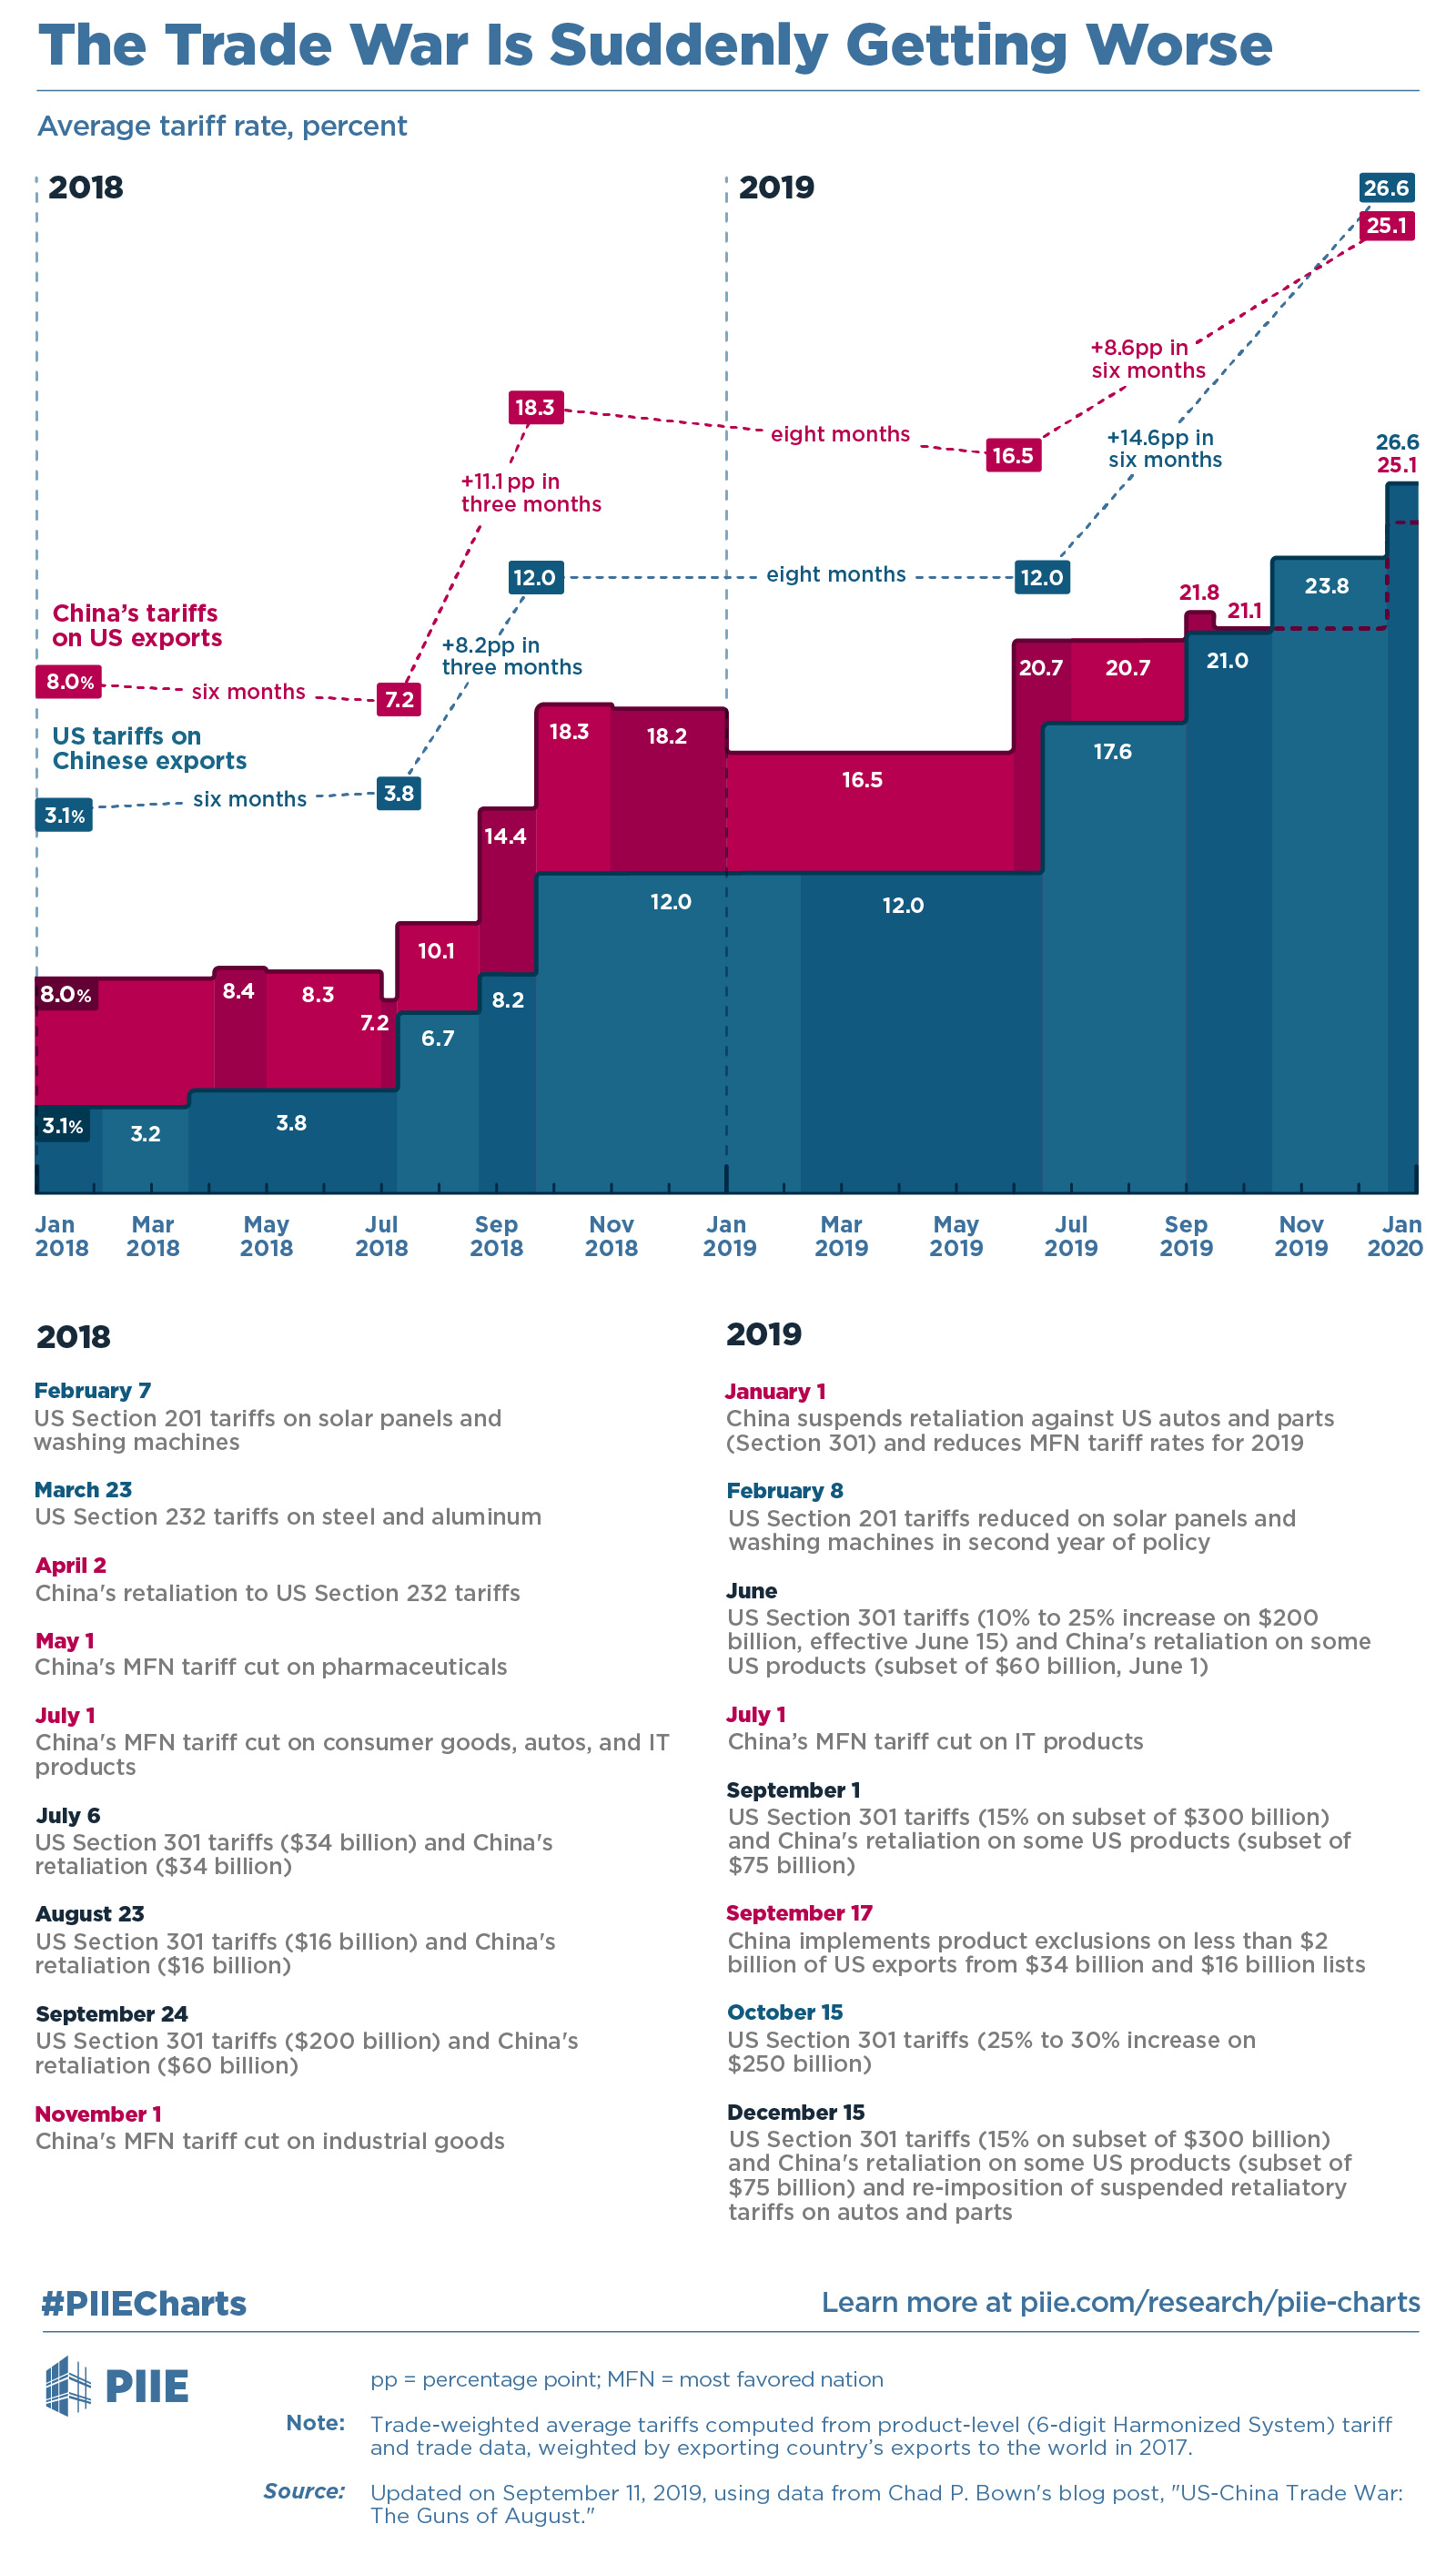
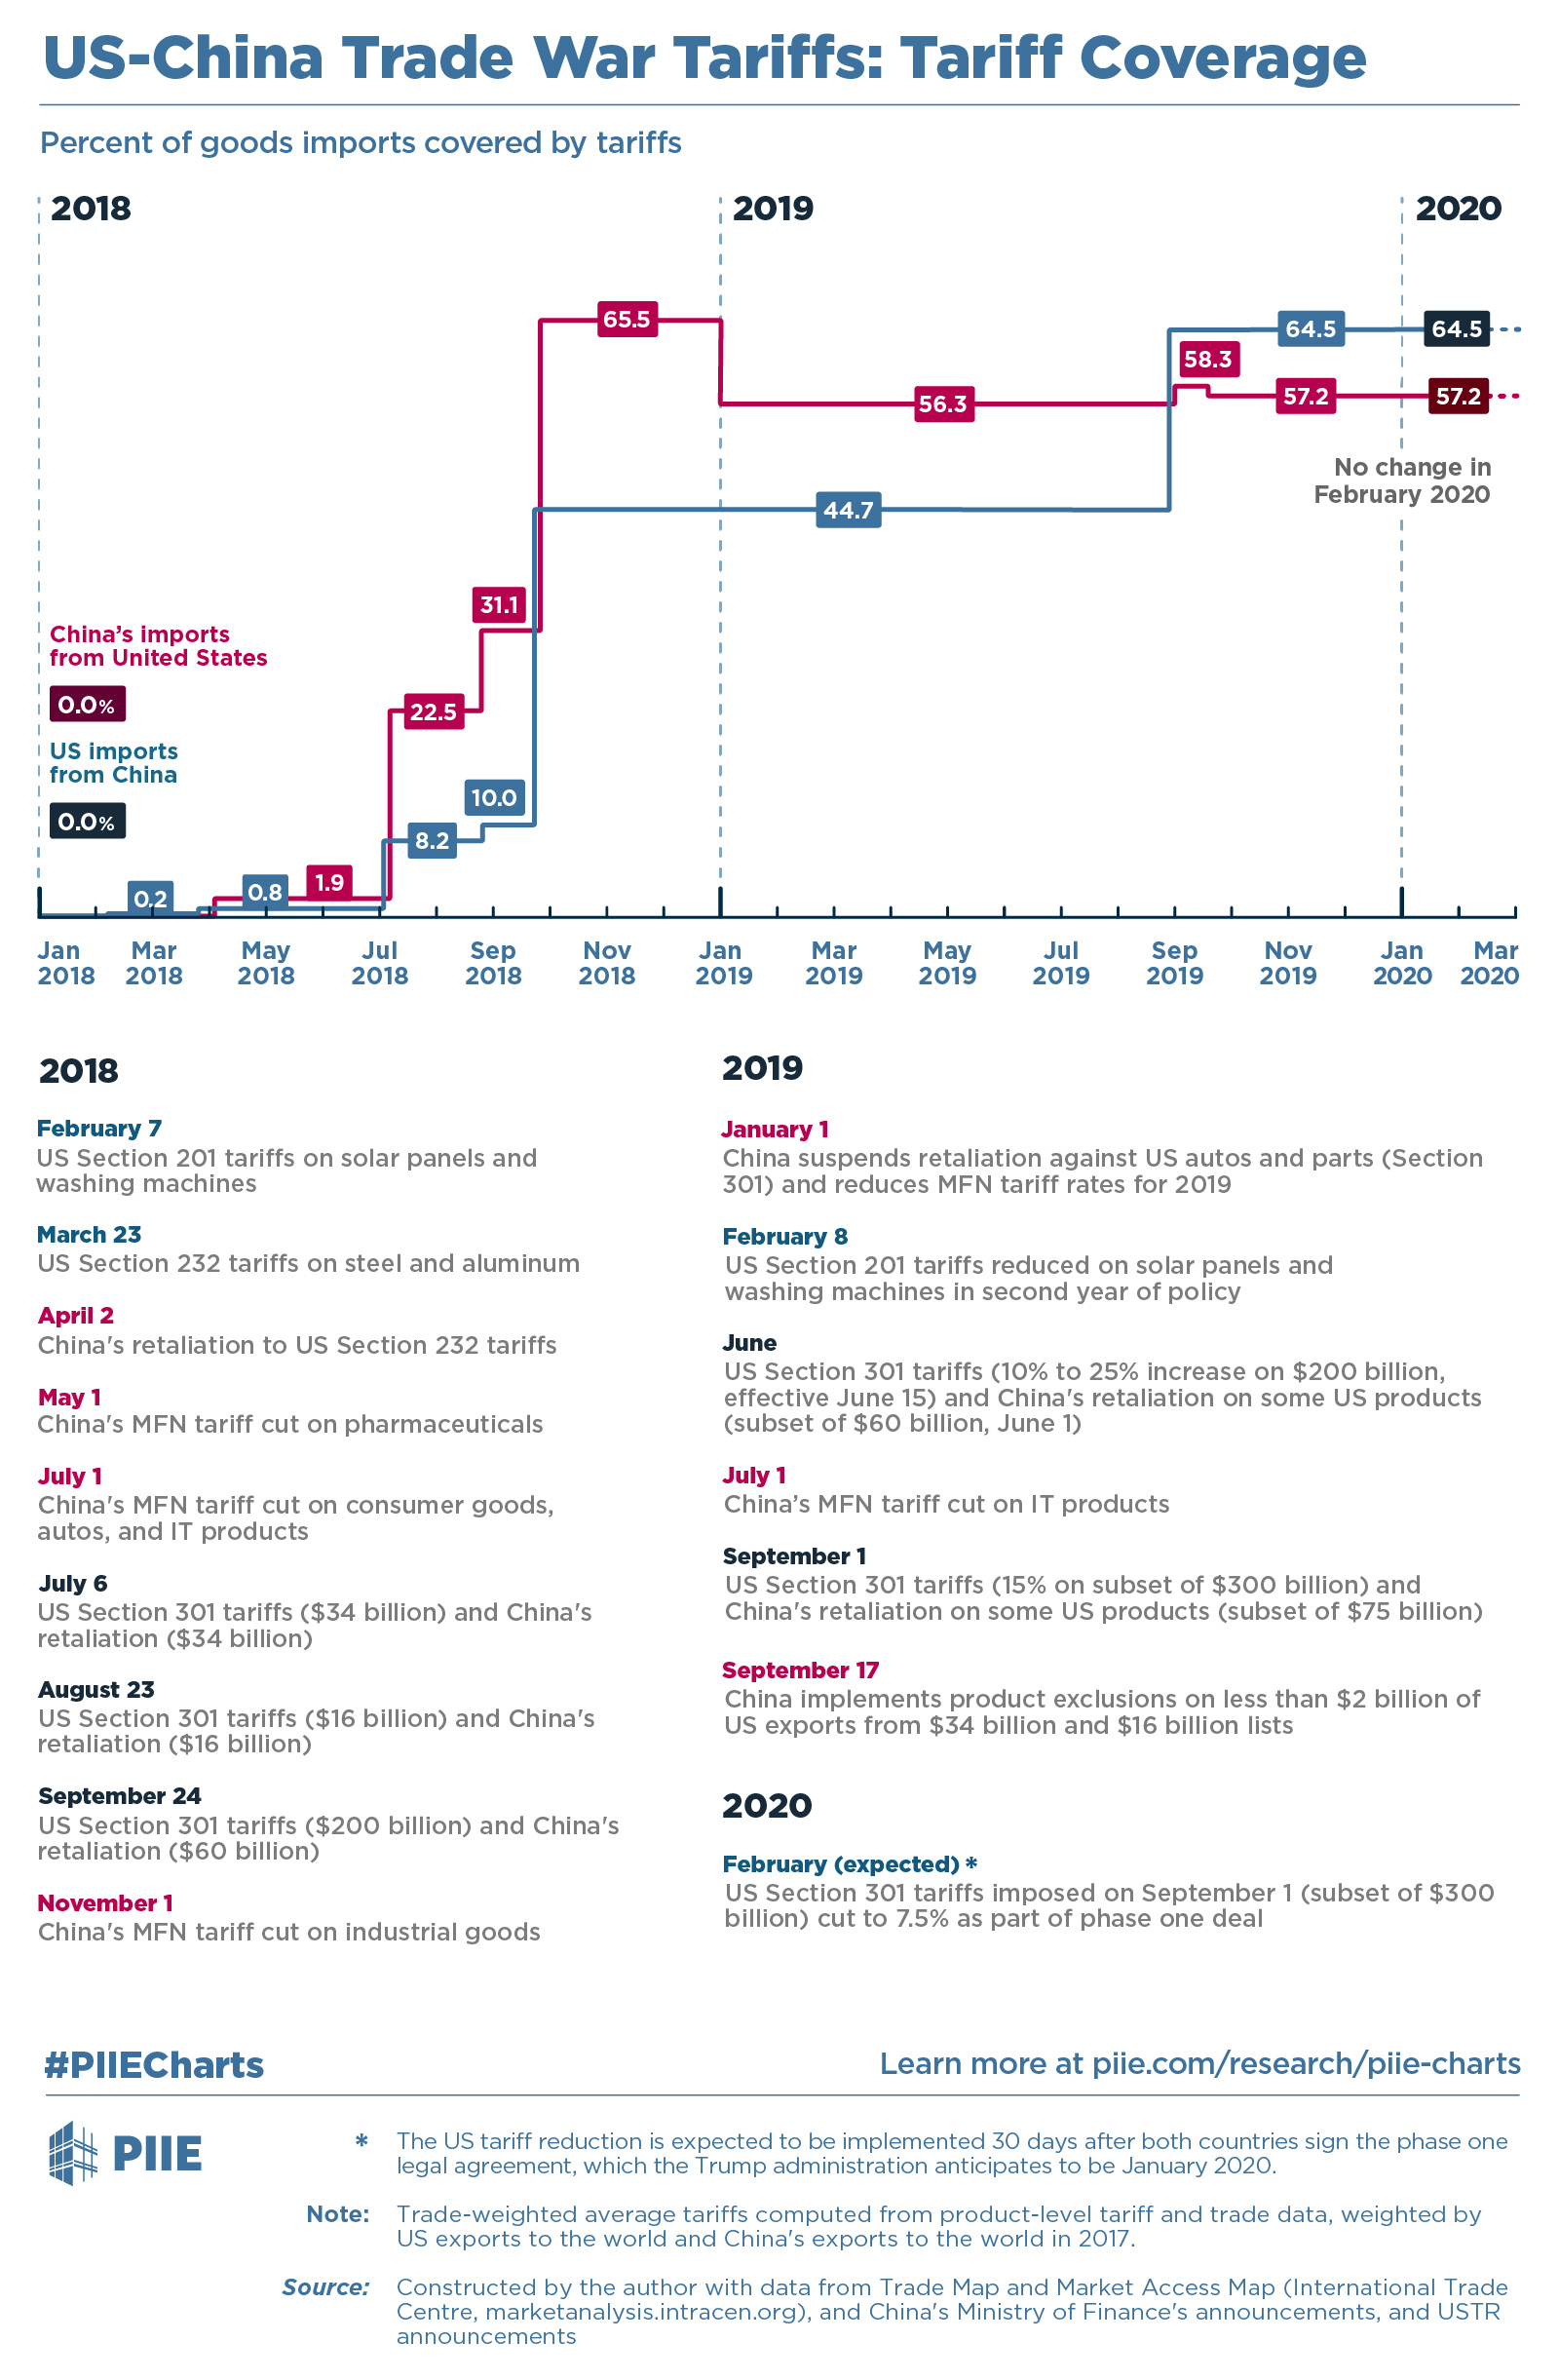
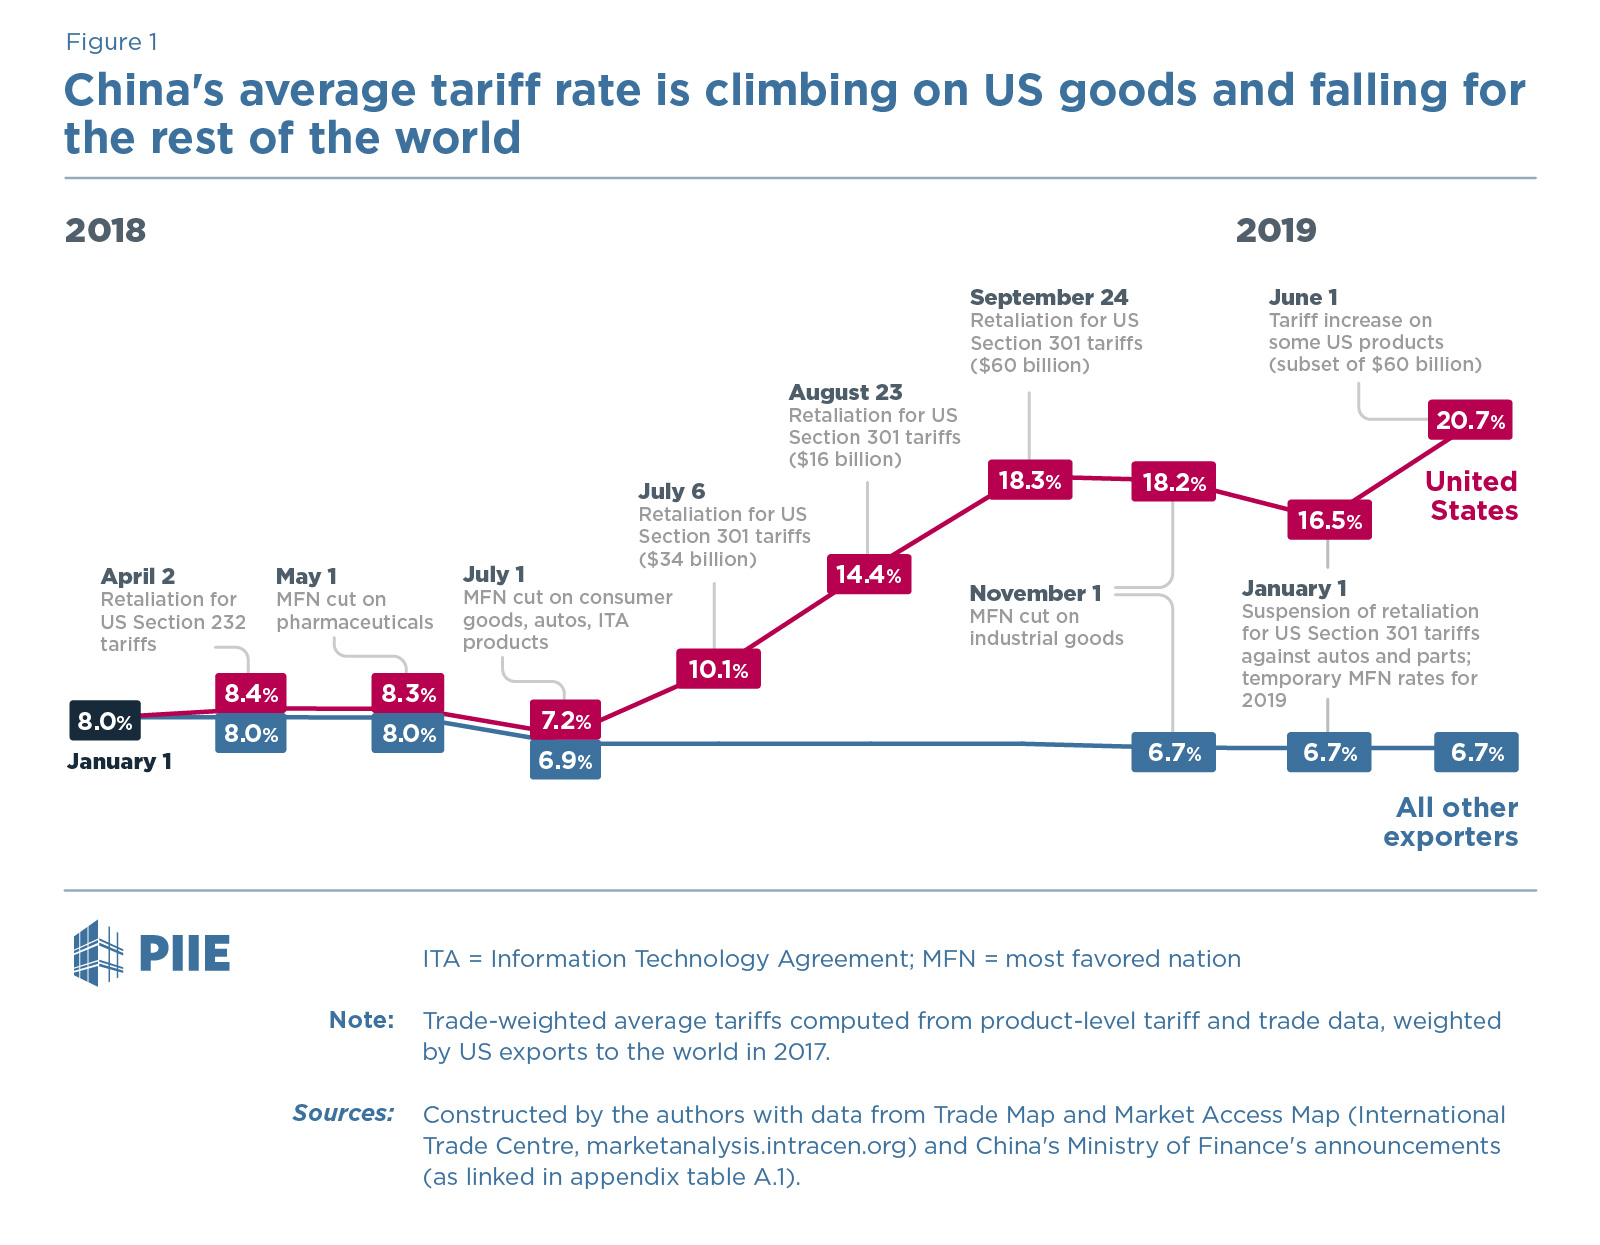
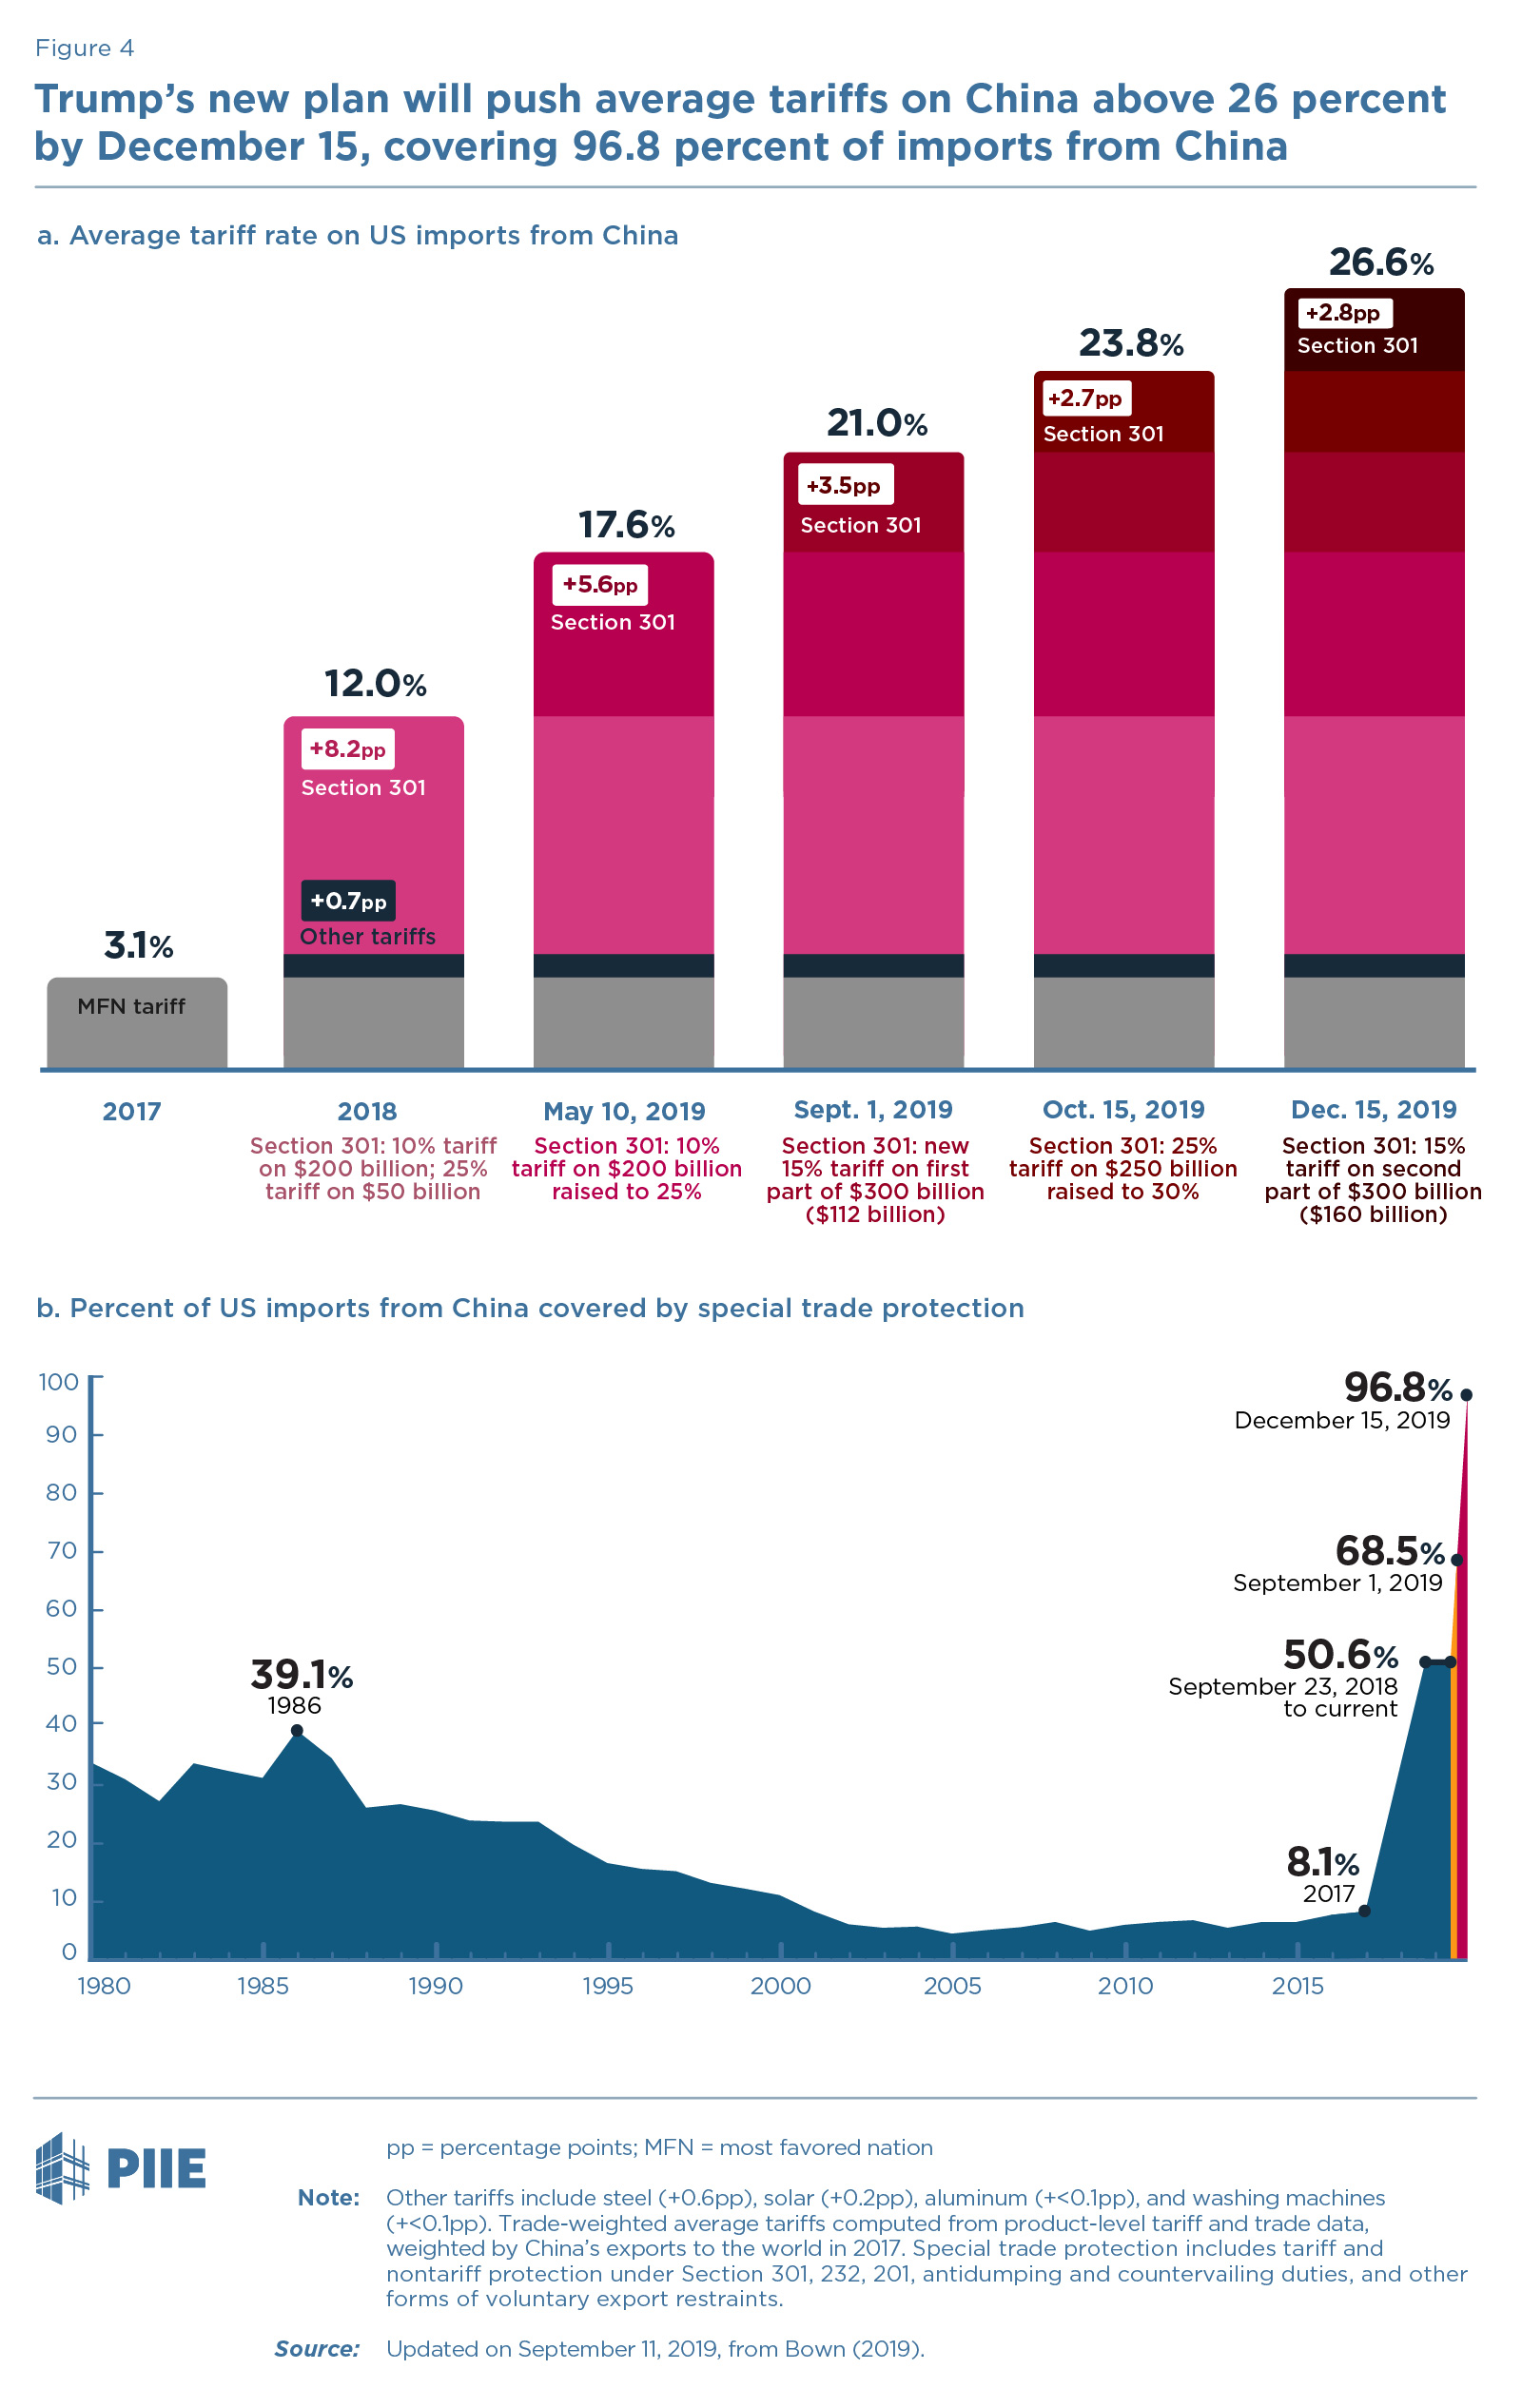
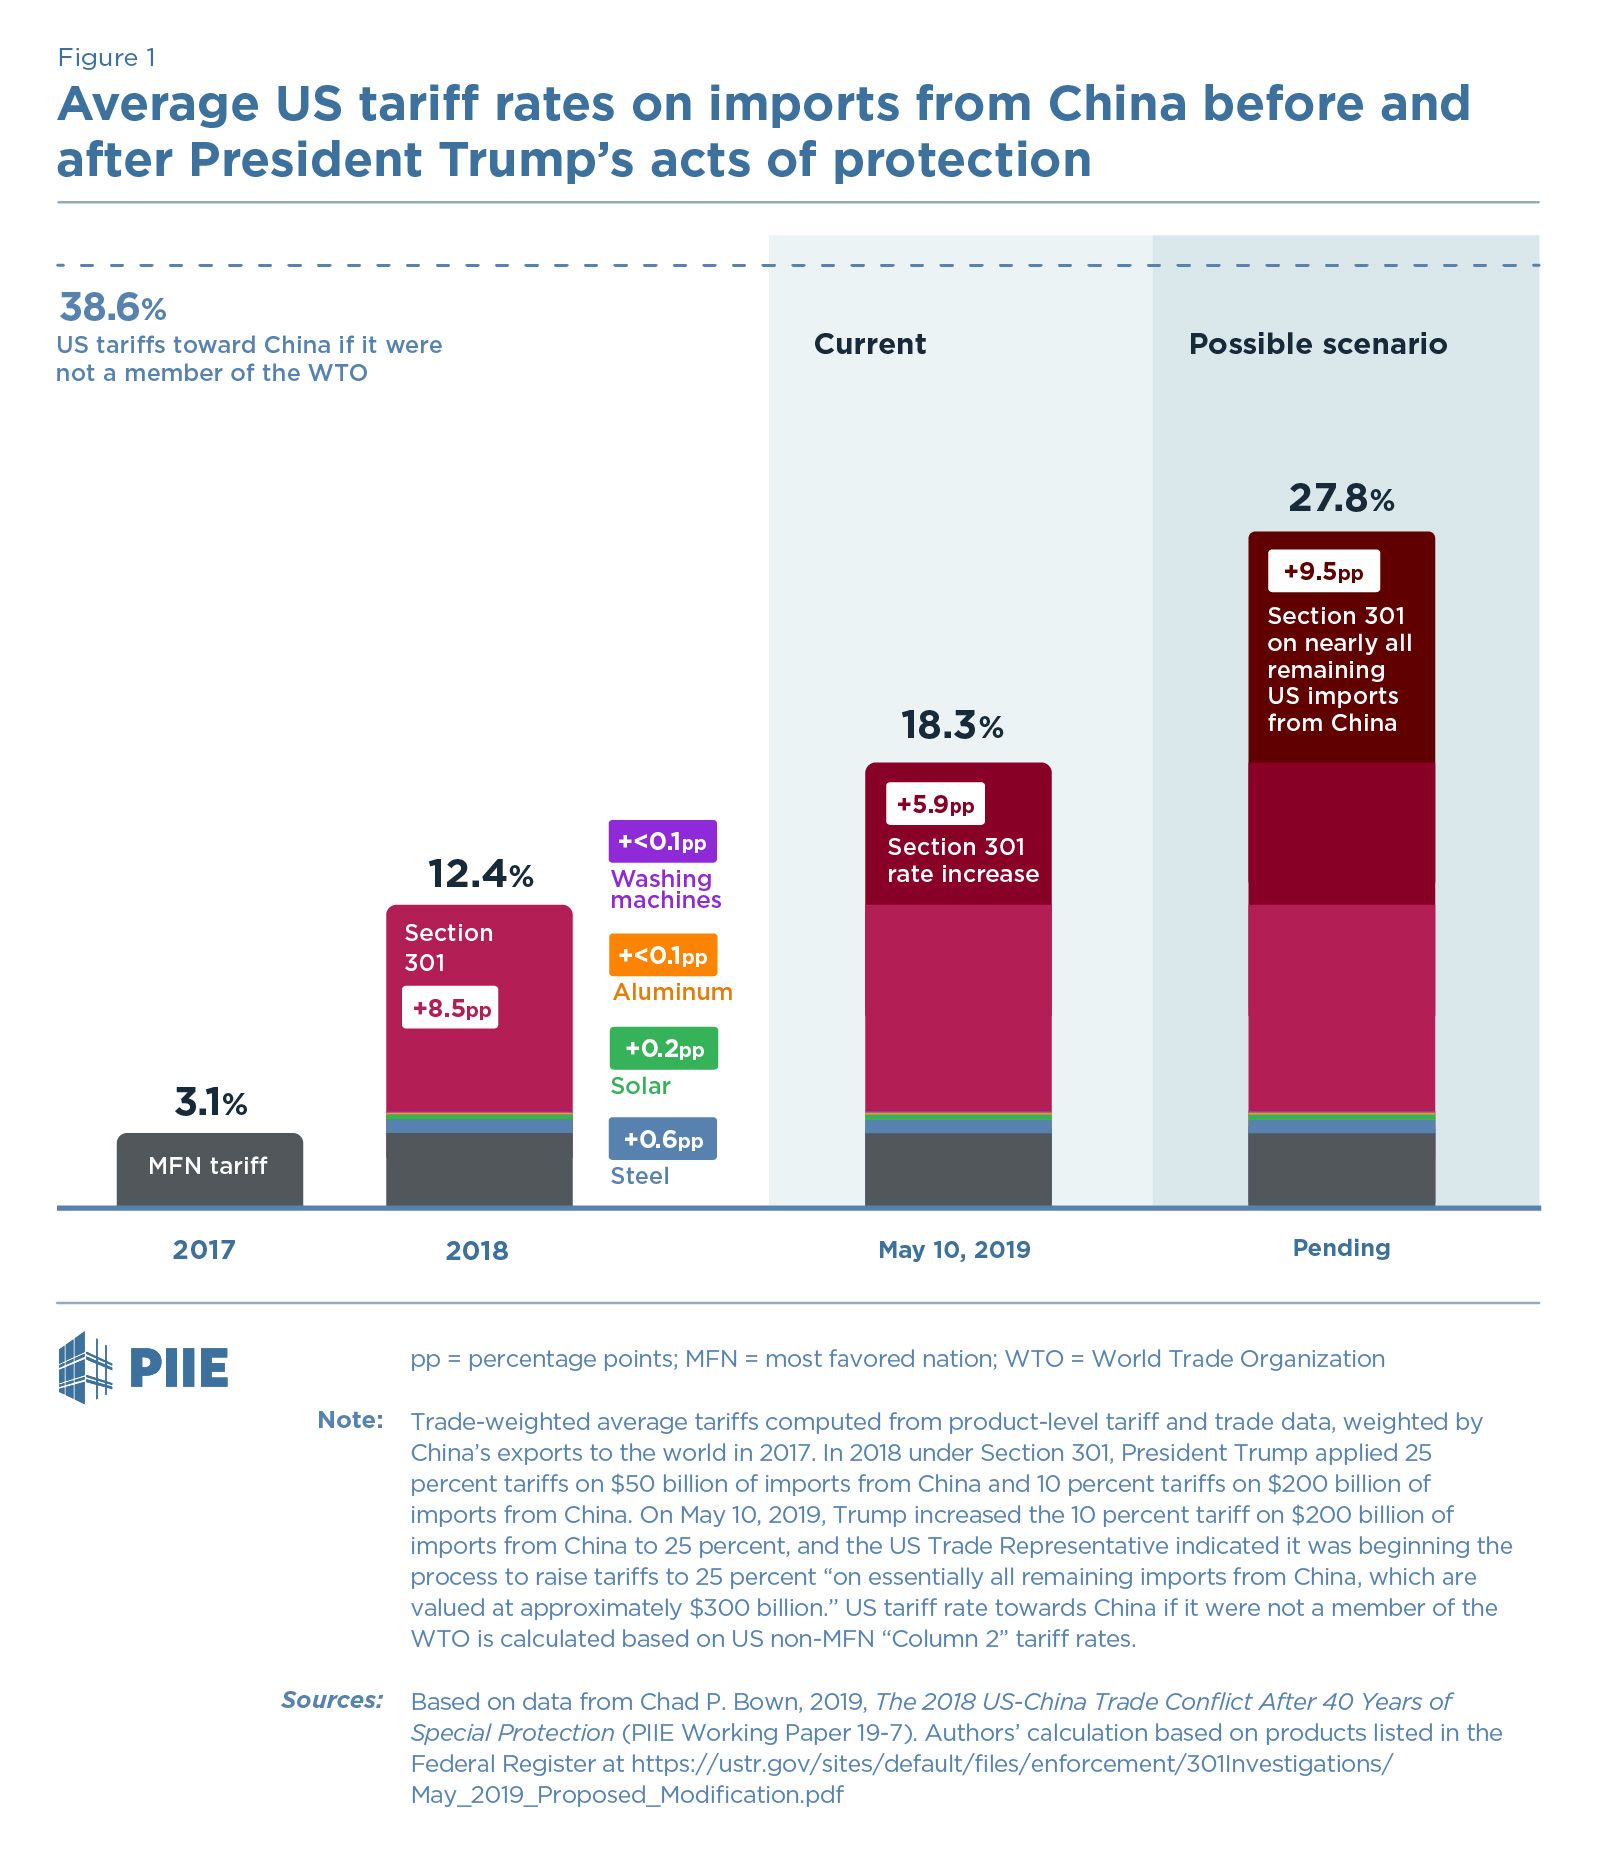
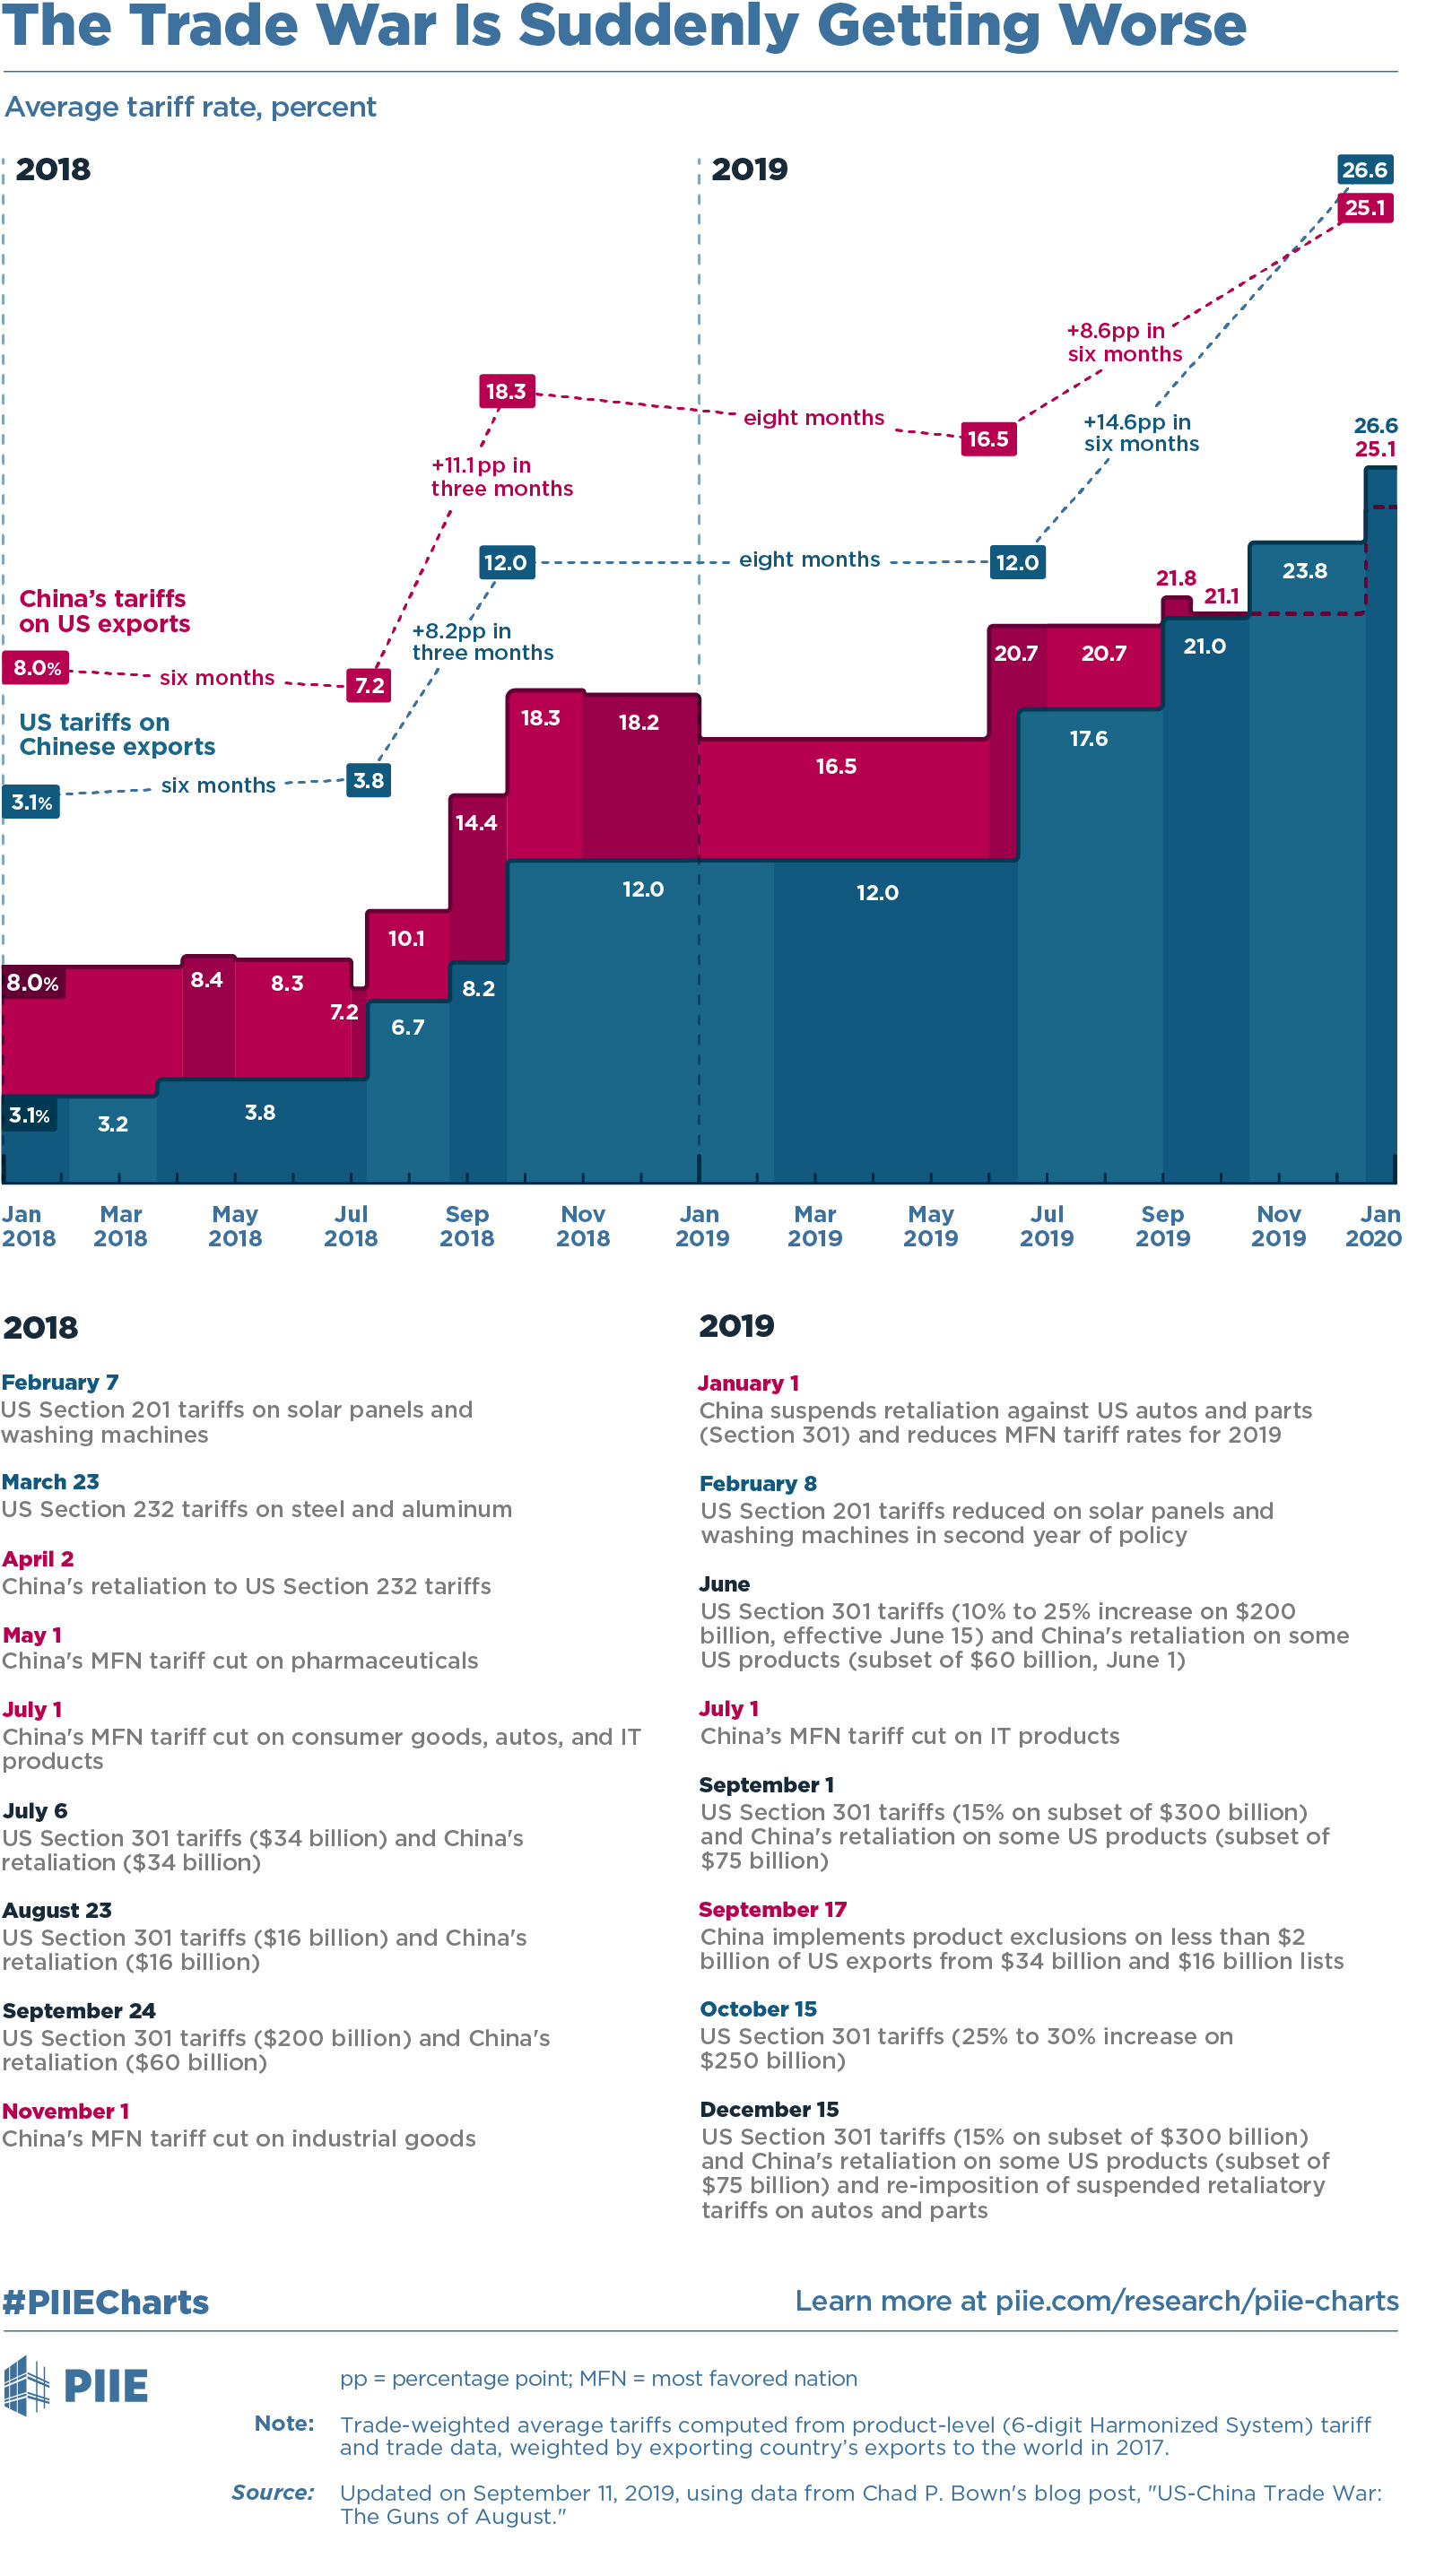
US-China Tariff Rate Tracker
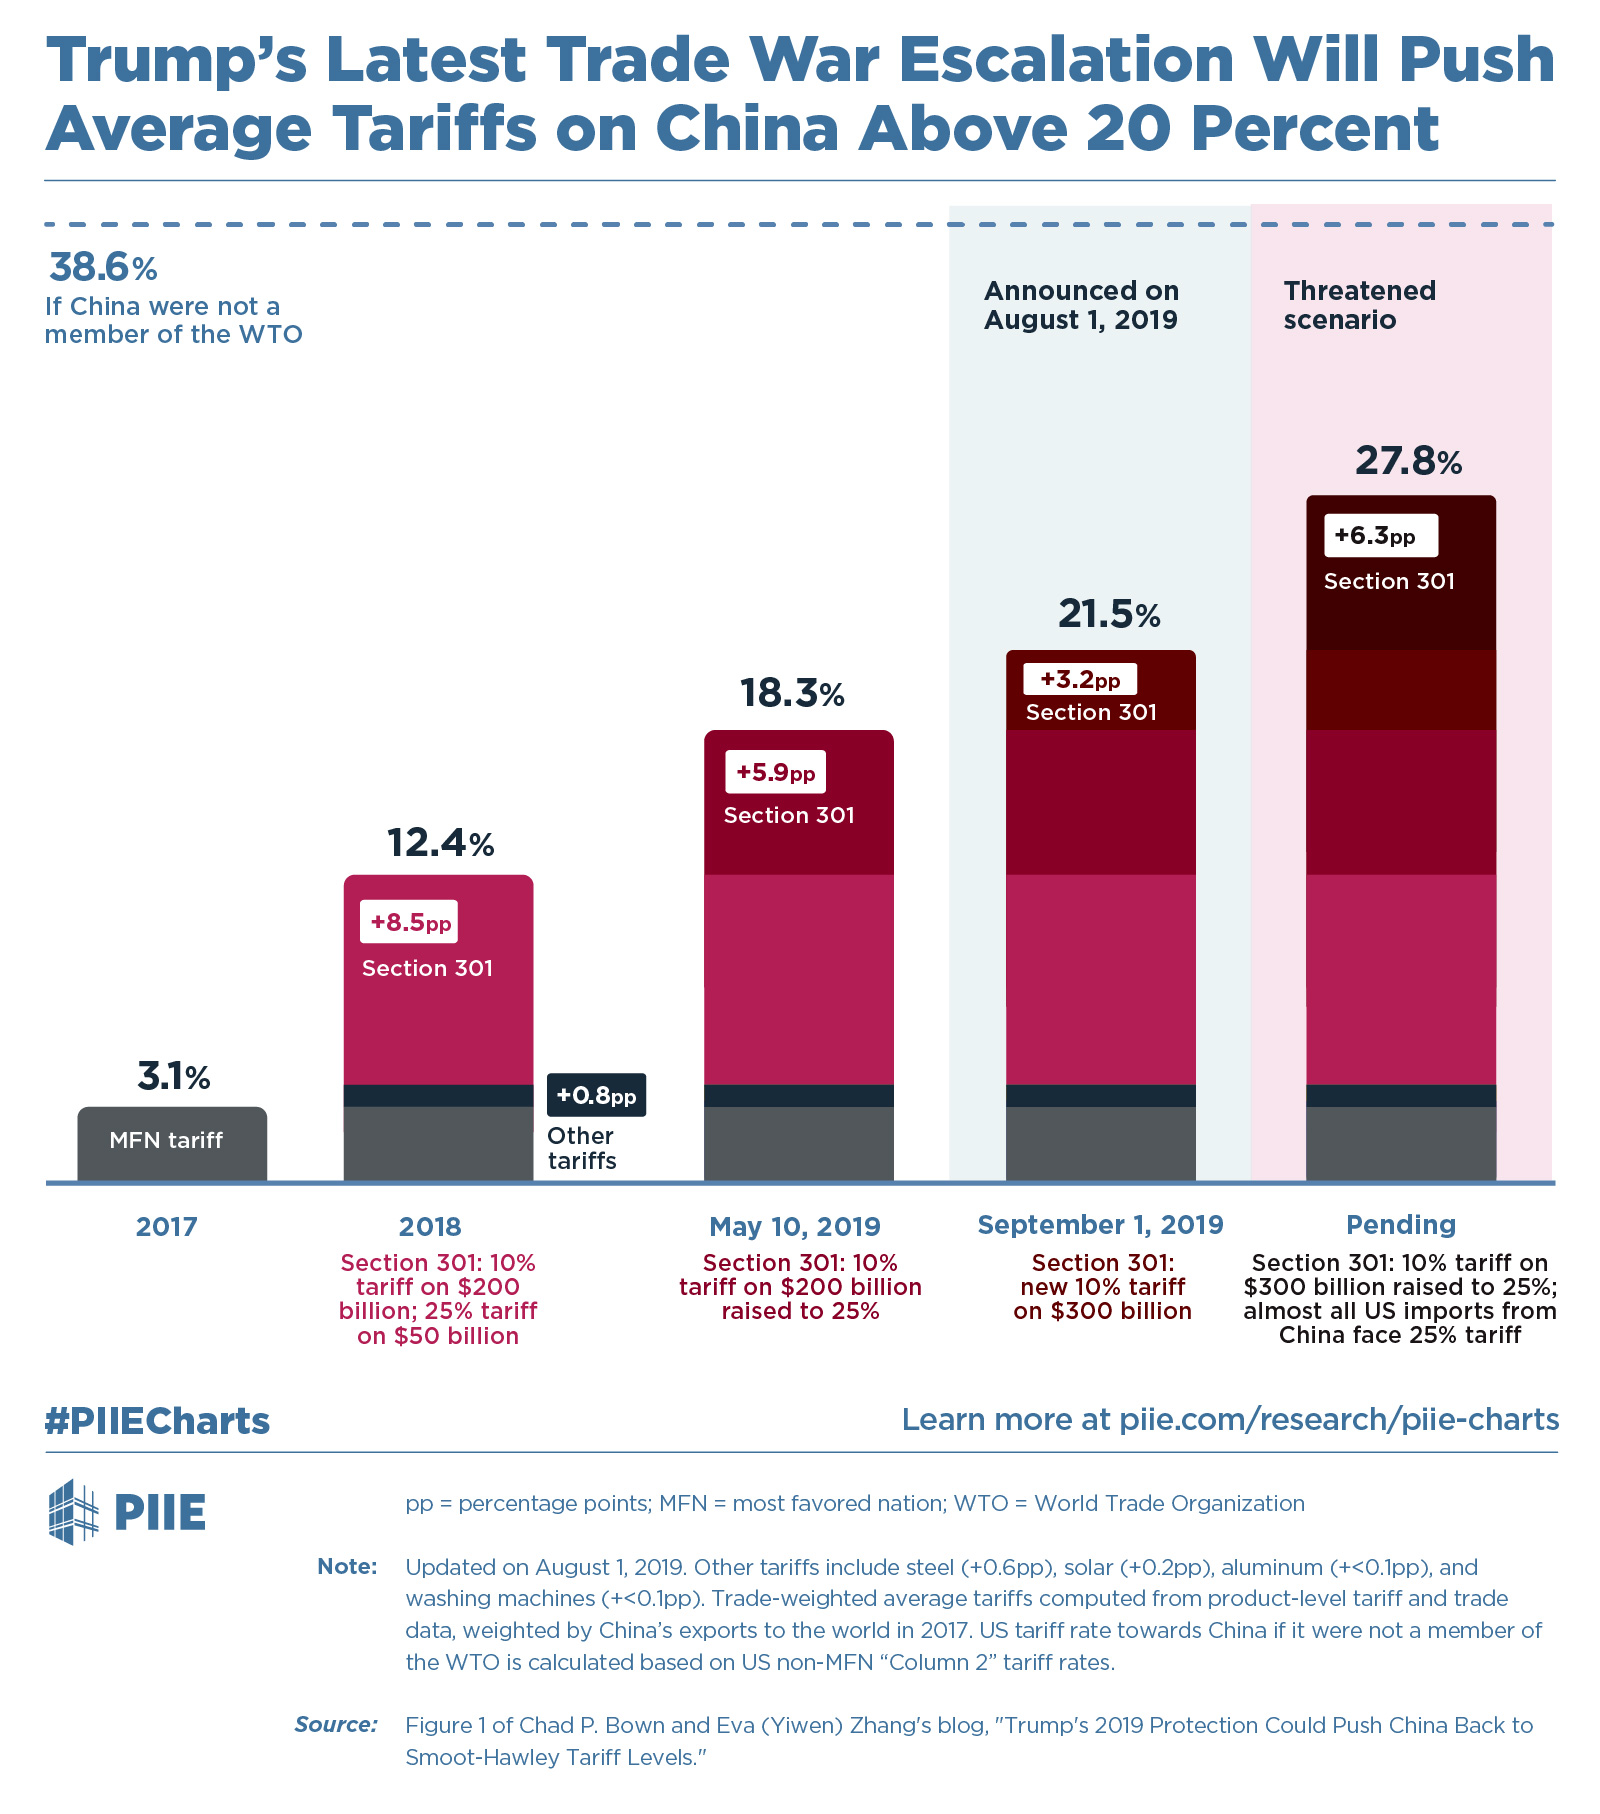
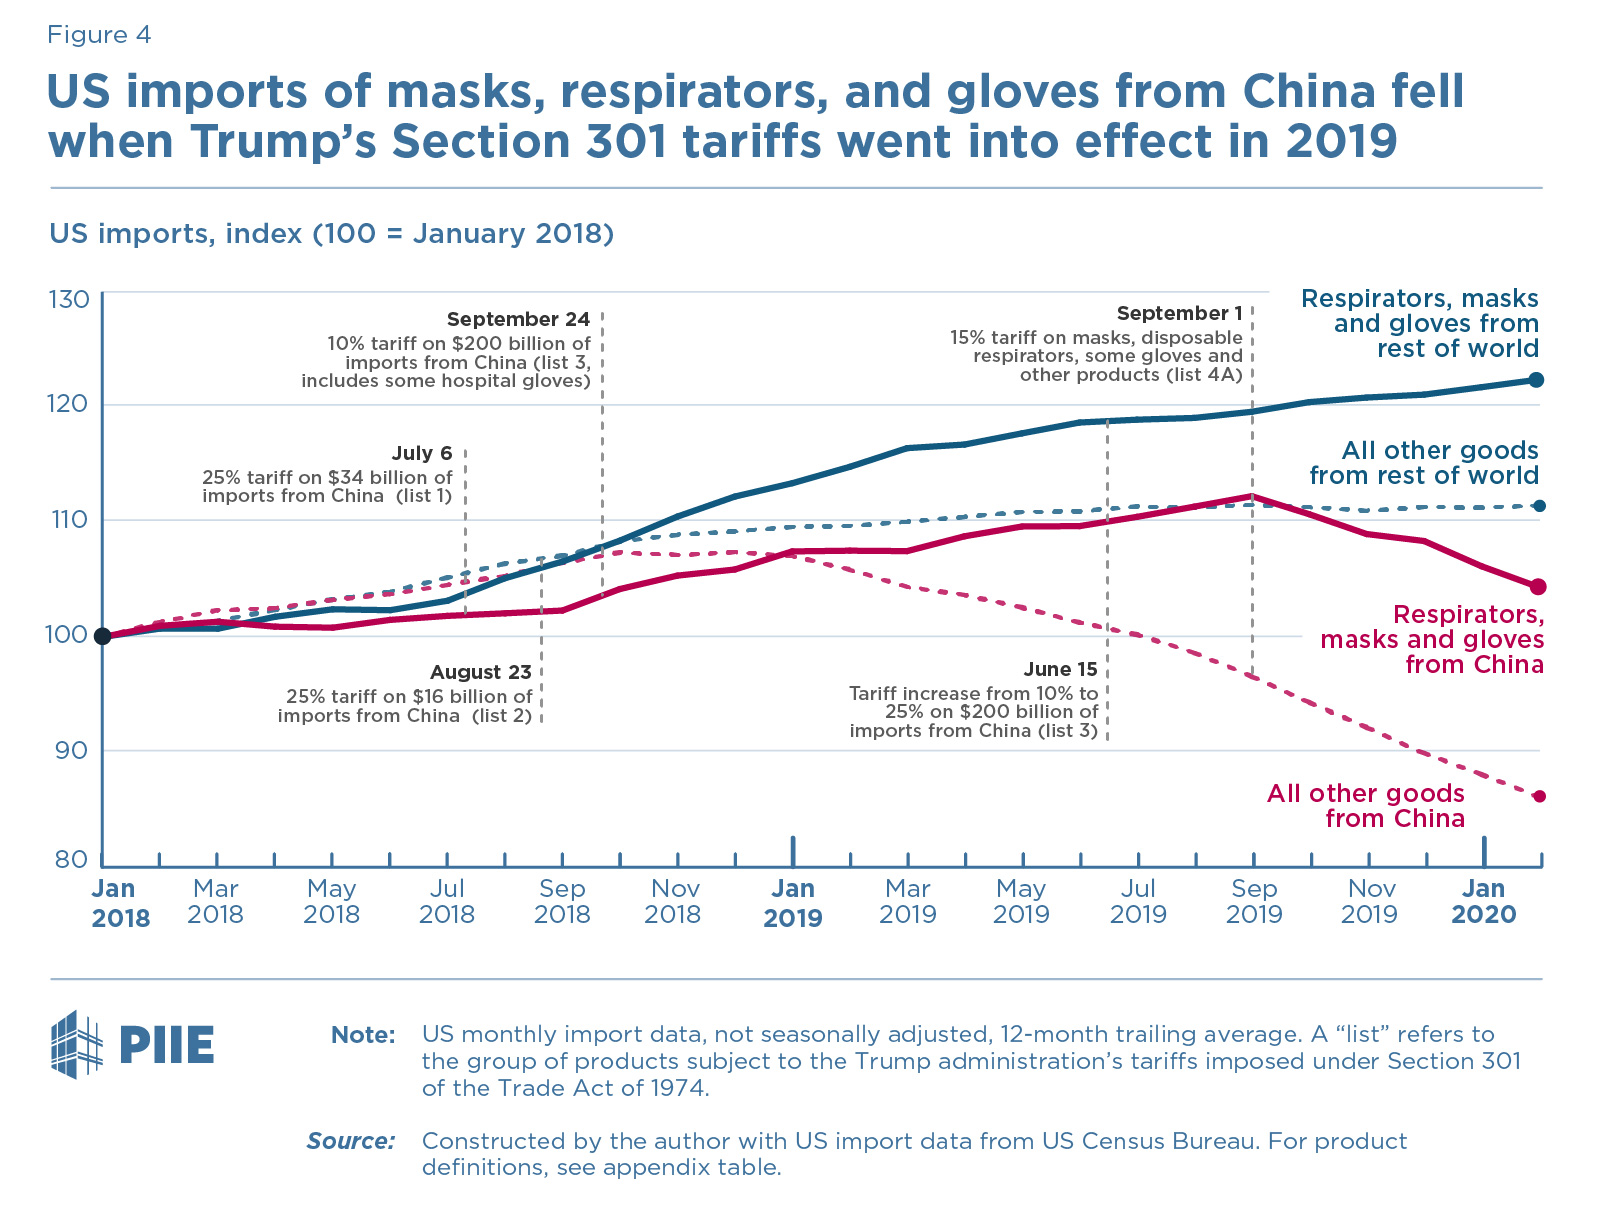
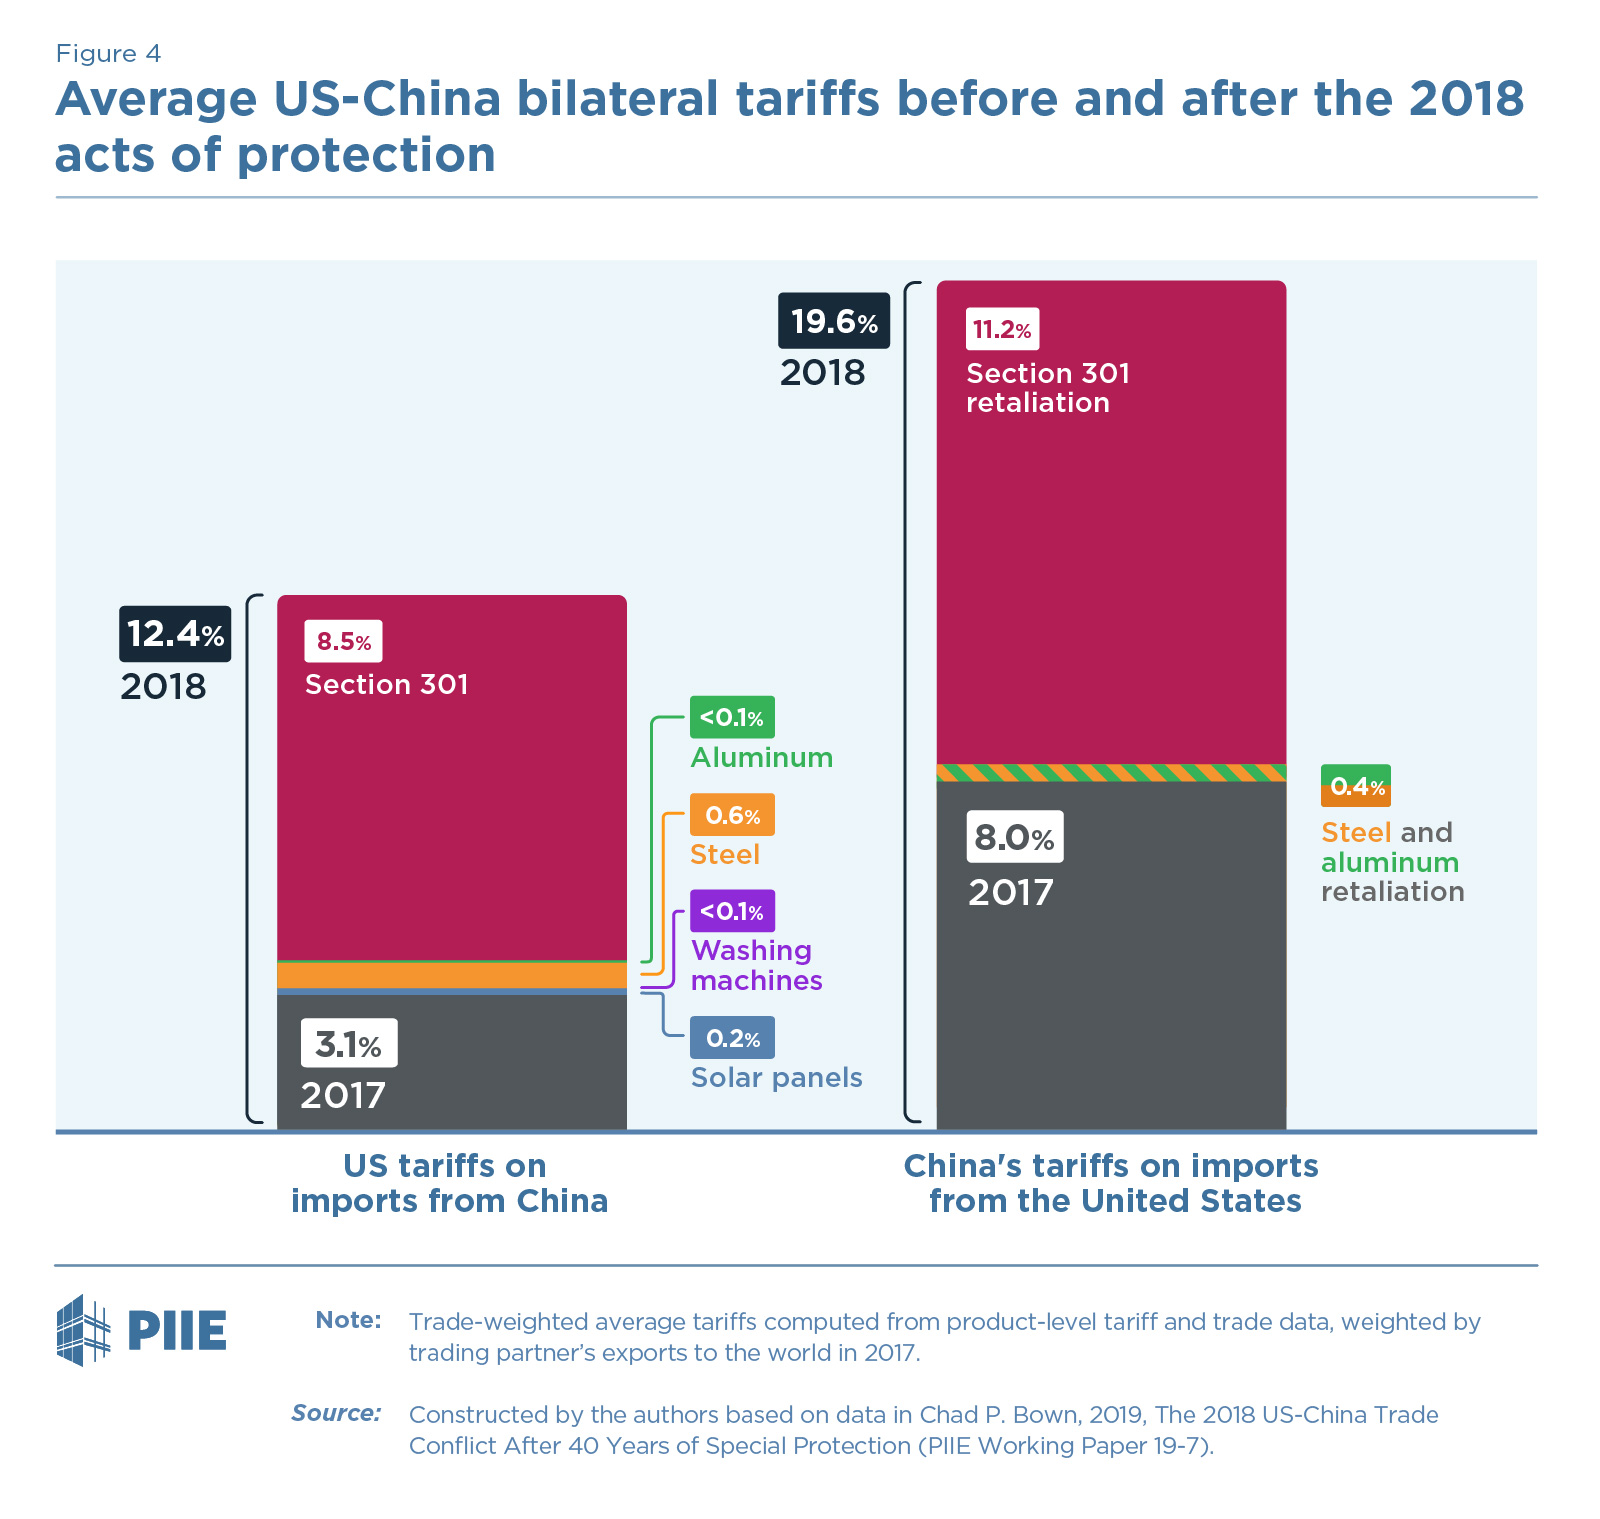
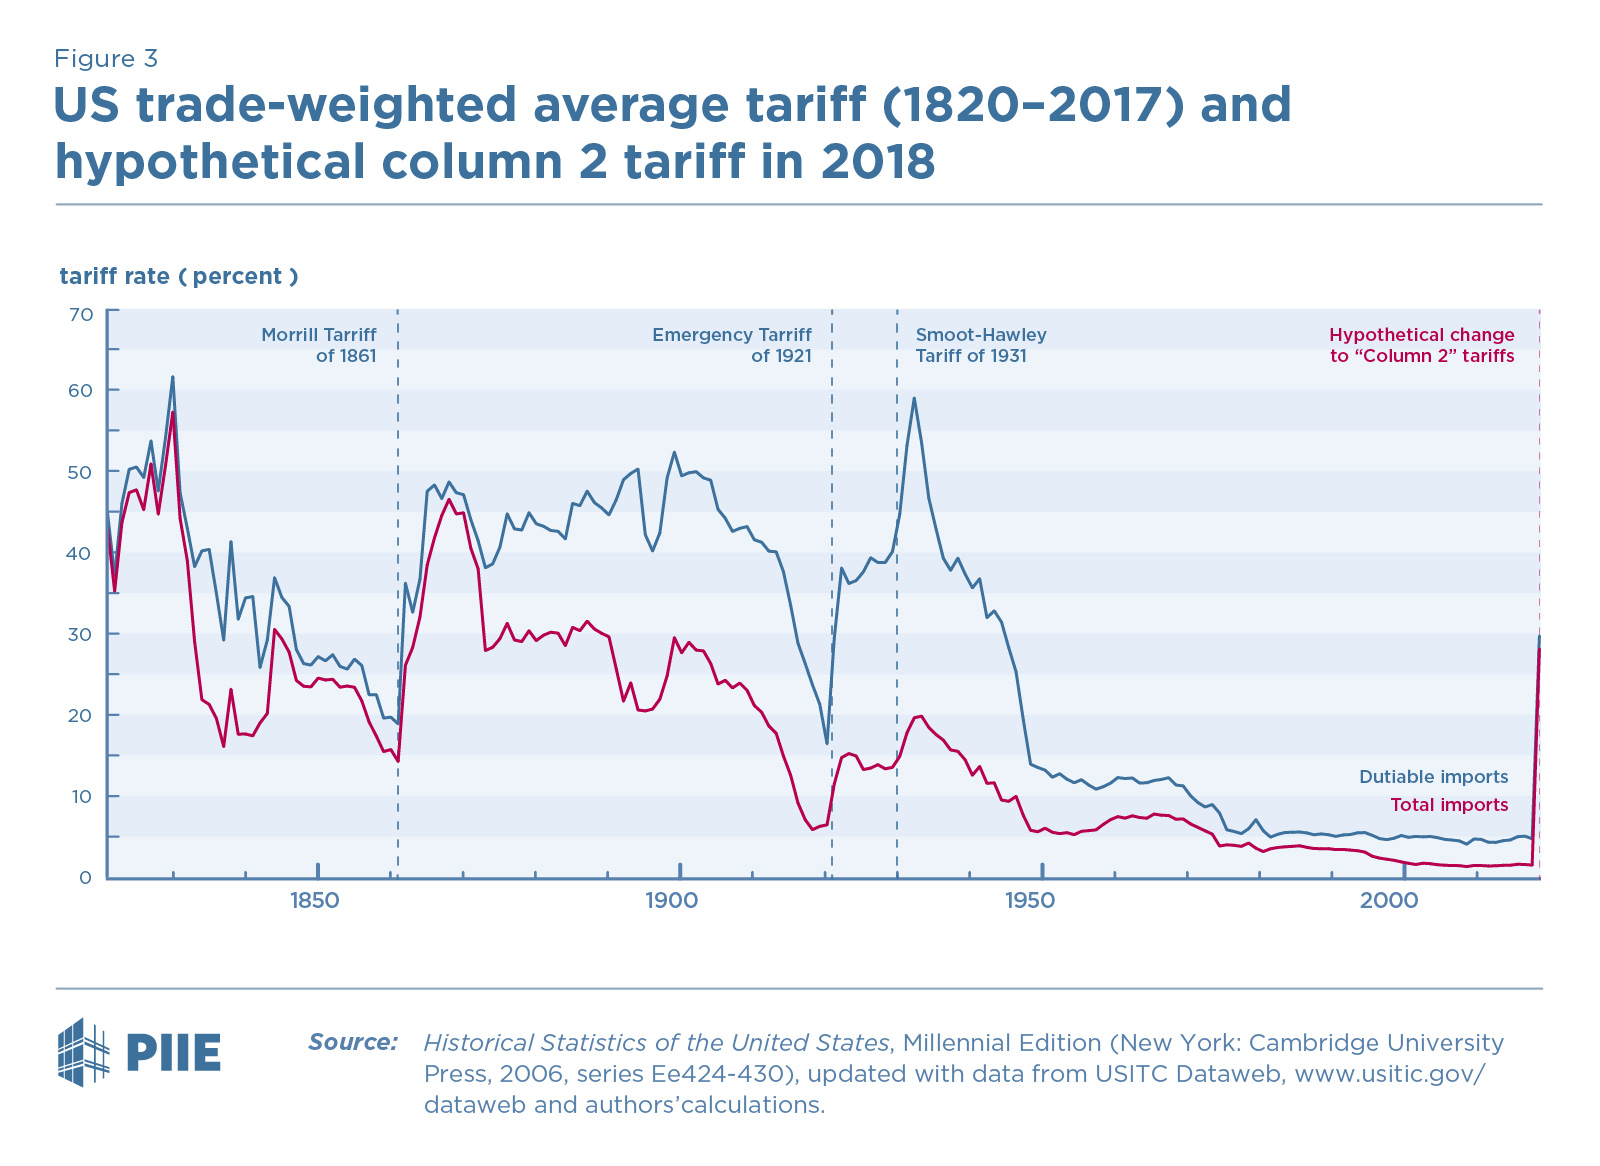
The use of tariffs by the Trump administration, and the corresponding retaliation by the Xi regime, pushed tariff rates on goods moving between the US and China to historic levels. The US-China trade conflict has become one of the most disruptive economic actions of the 21st century, and continues to have wide reaching economic effects, despite being somewhat overshadowed by the COVID pandemic in 2020. In order the quantify the escalation of the trade war, PIIE created an infographic chart showing the rise of US tariff rates as well as the Chinese response, the chart was periodically updated as new trade actions were instituted.
The Mission:
Produce a series of charts and data graphics to illustrate trade actions and consequences of the US-China trade war.
The Client:
Peterson Institute
The Time:
Mid 2018 - Present
My Role:
Concept Development, Graphic Design, Production
Other Credits
Steve Weisman: Creative Direction
Melina Kolb: Creative Direction, Copy-writing, Editing
Madona Devasahayam: Copy-editing
Chad Bown: Expert
Madona Devasahayam: Copy-editing
Hexuan Li: Research
Melina Kolb: Creative Direction, Copy-writing, Editing
Madona Devasahayam: Copy-editing
Chad Bown: Expert
Madona Devasahayam: Copy-editing
Hexuan Li: Research
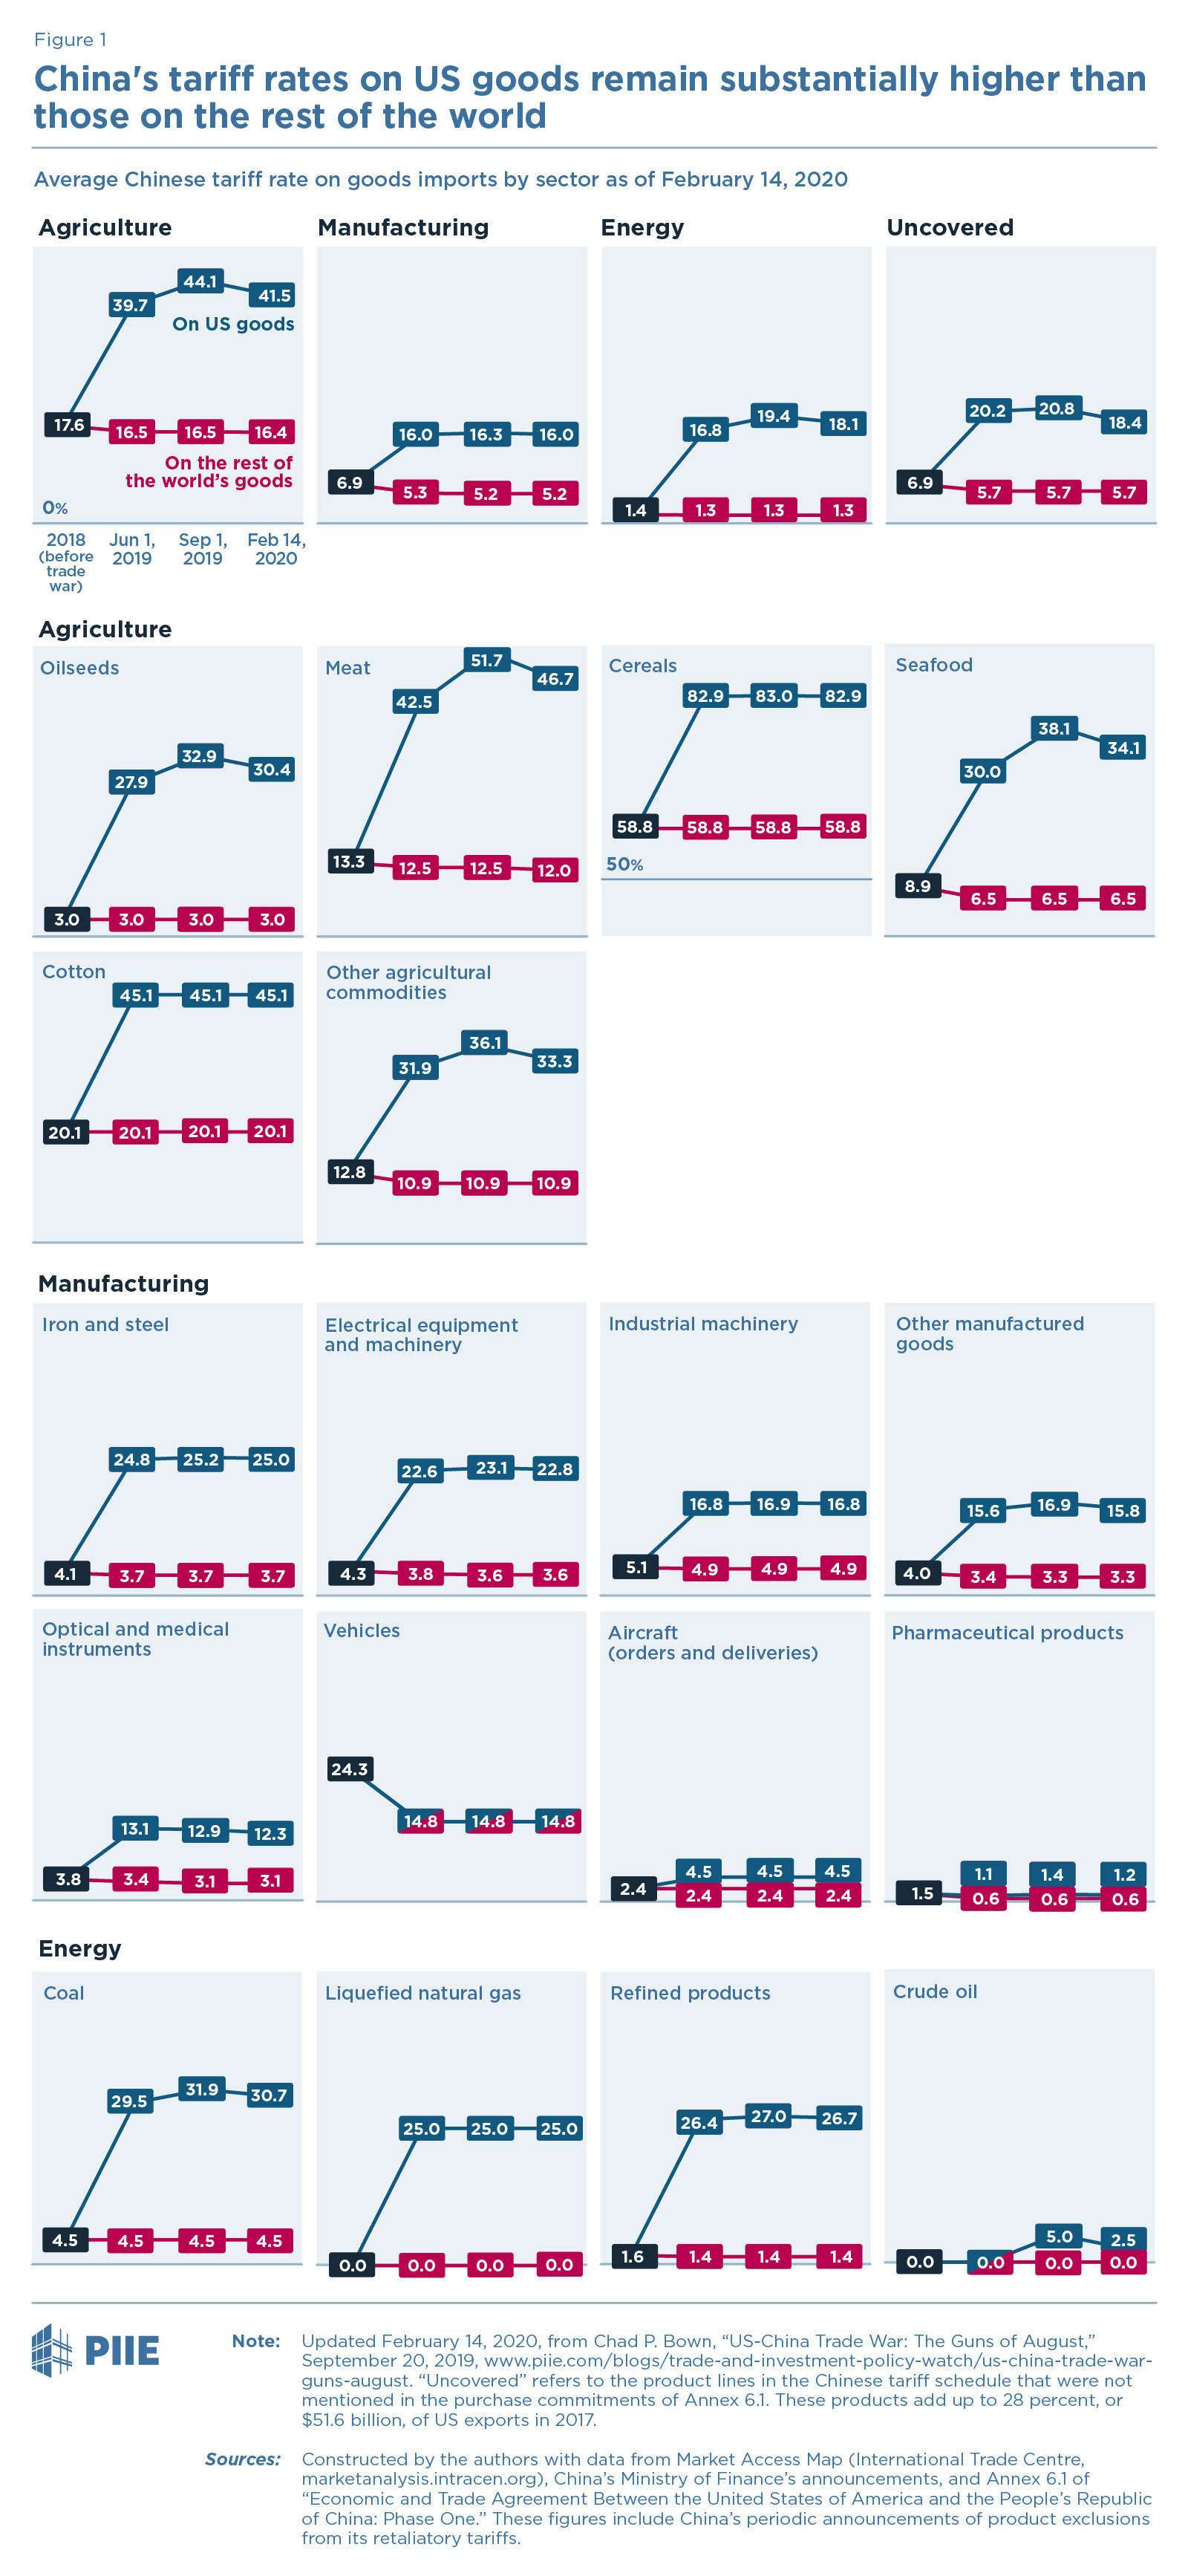
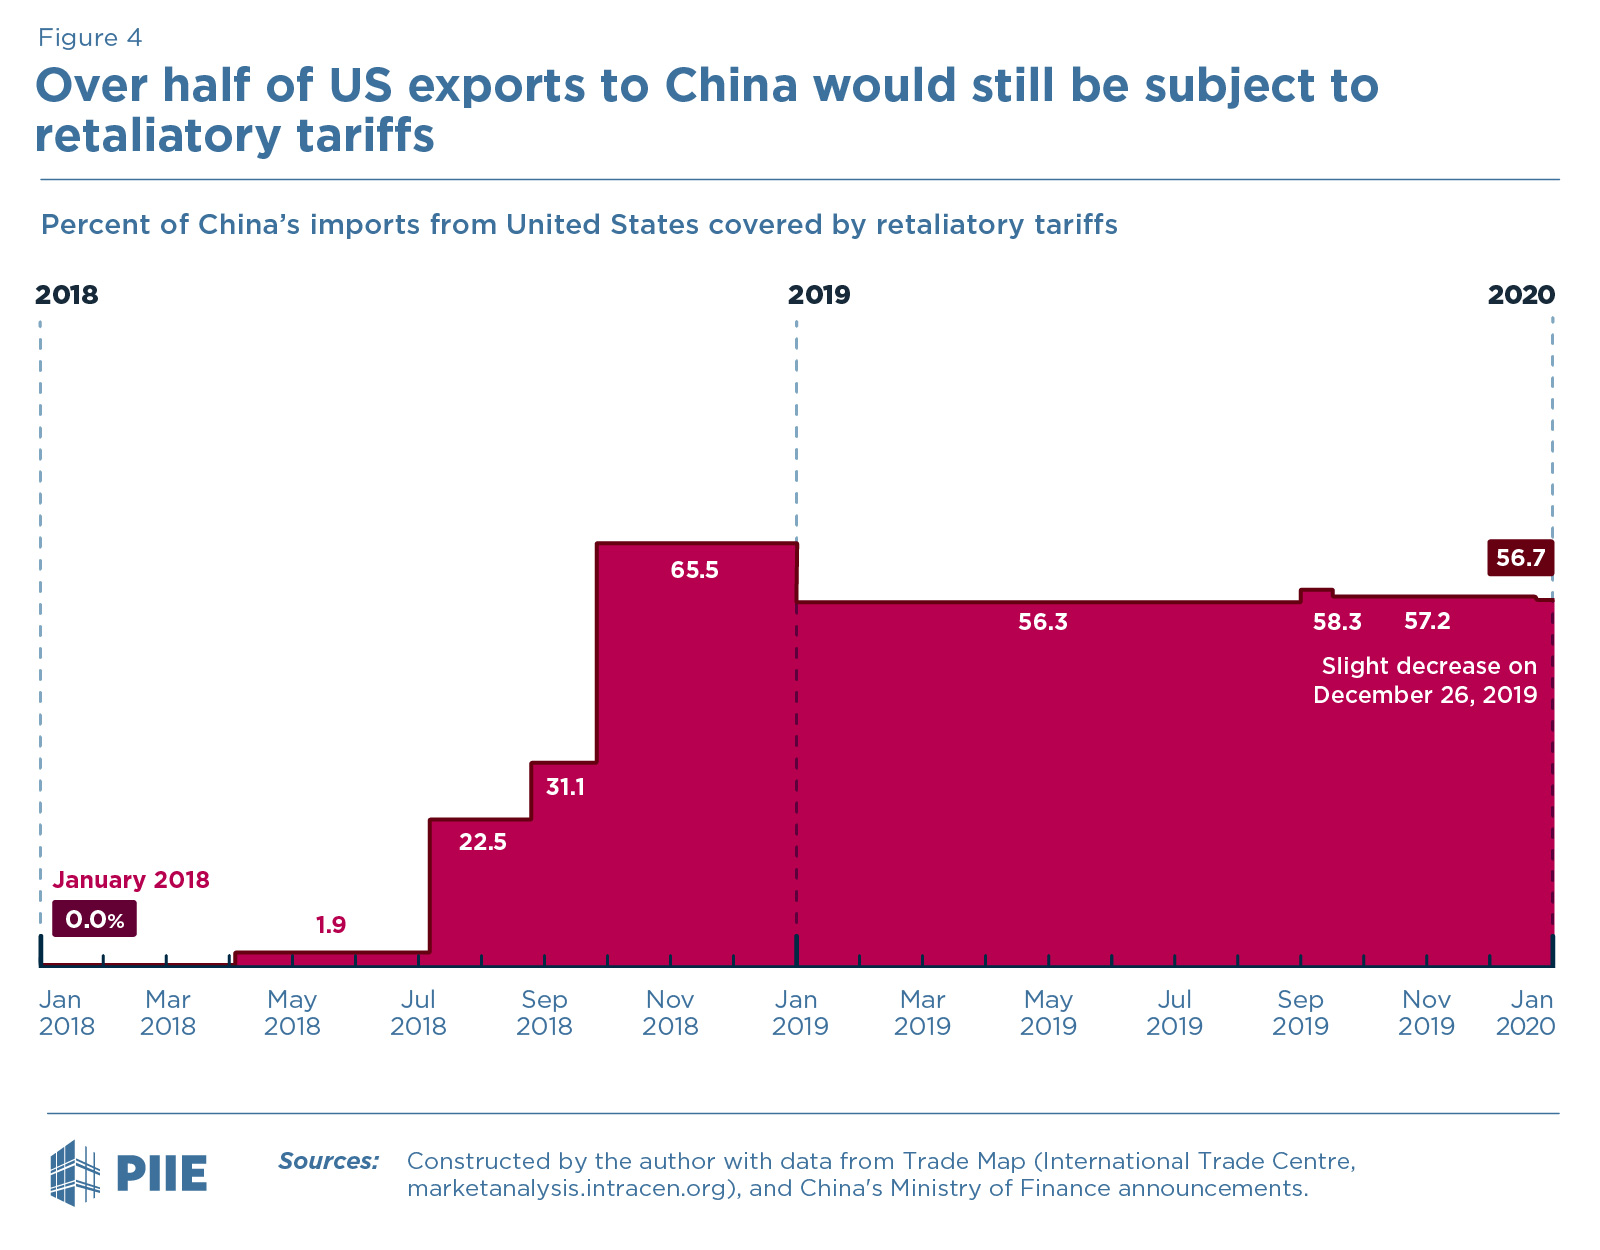
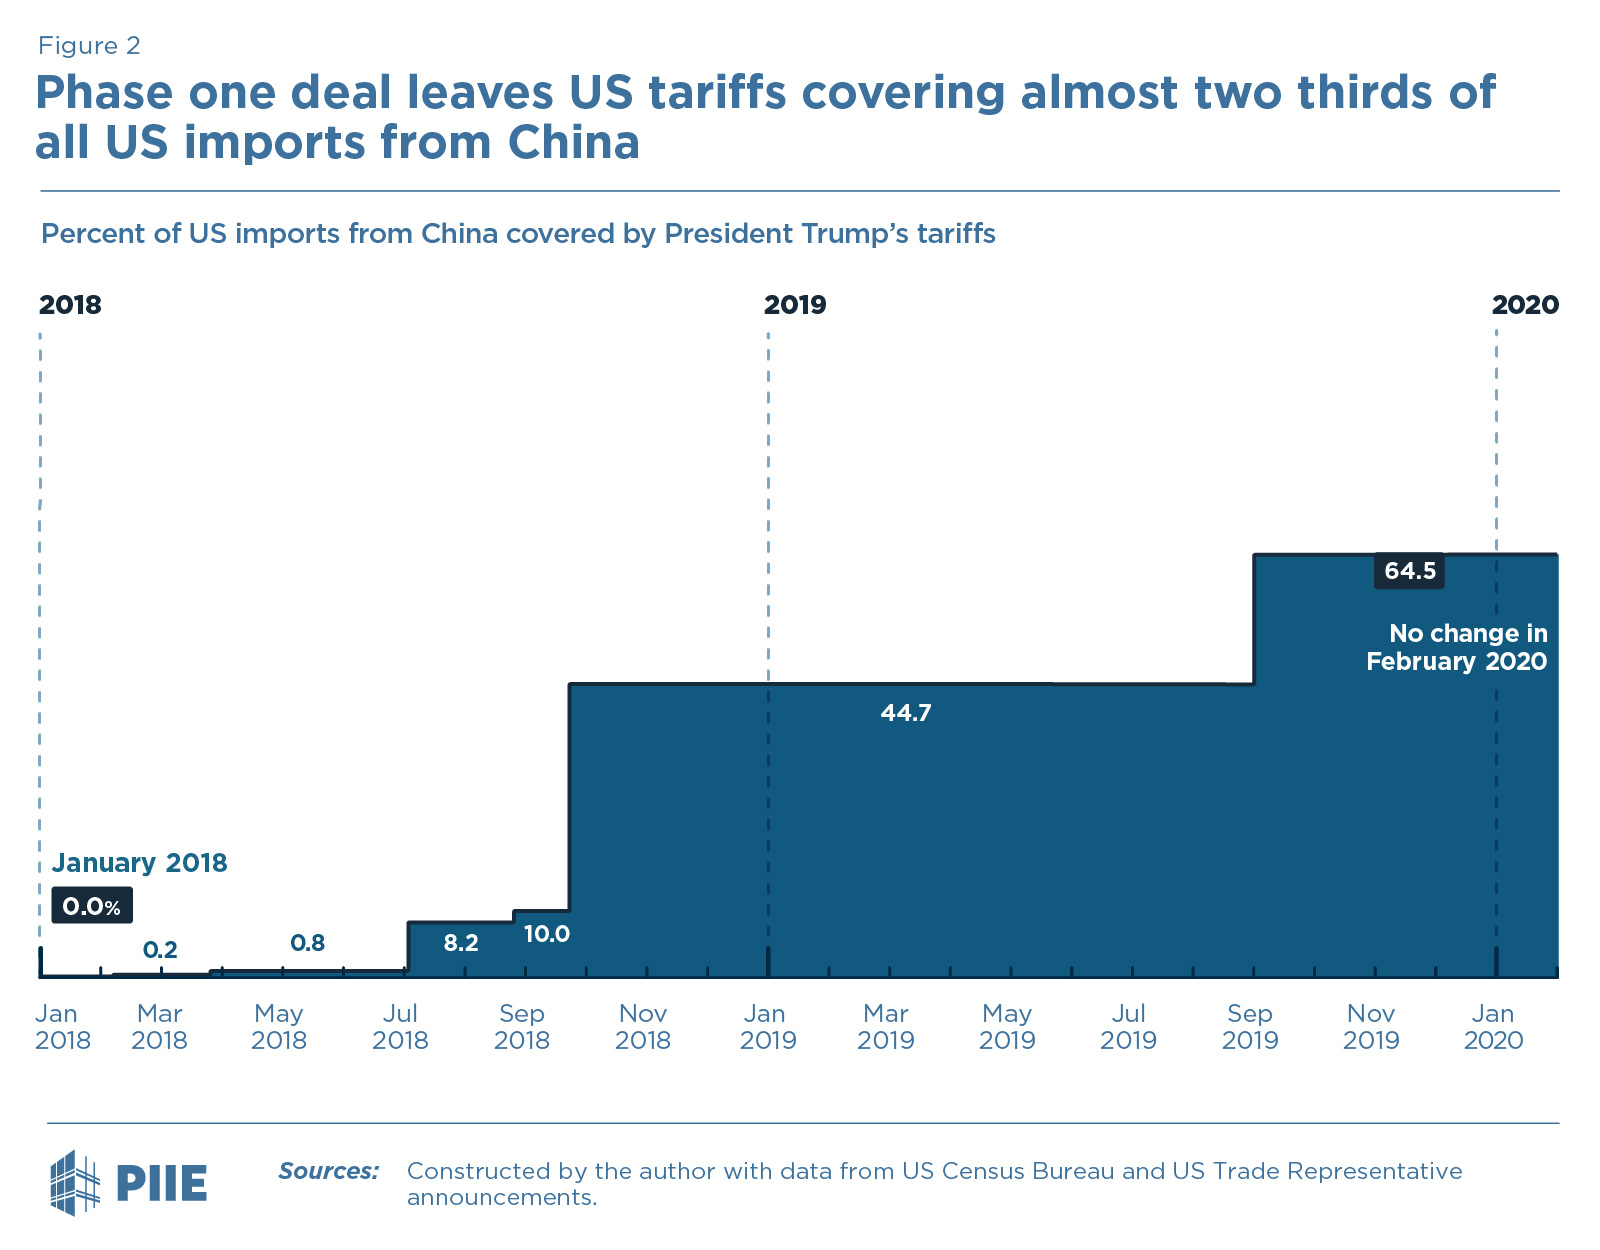
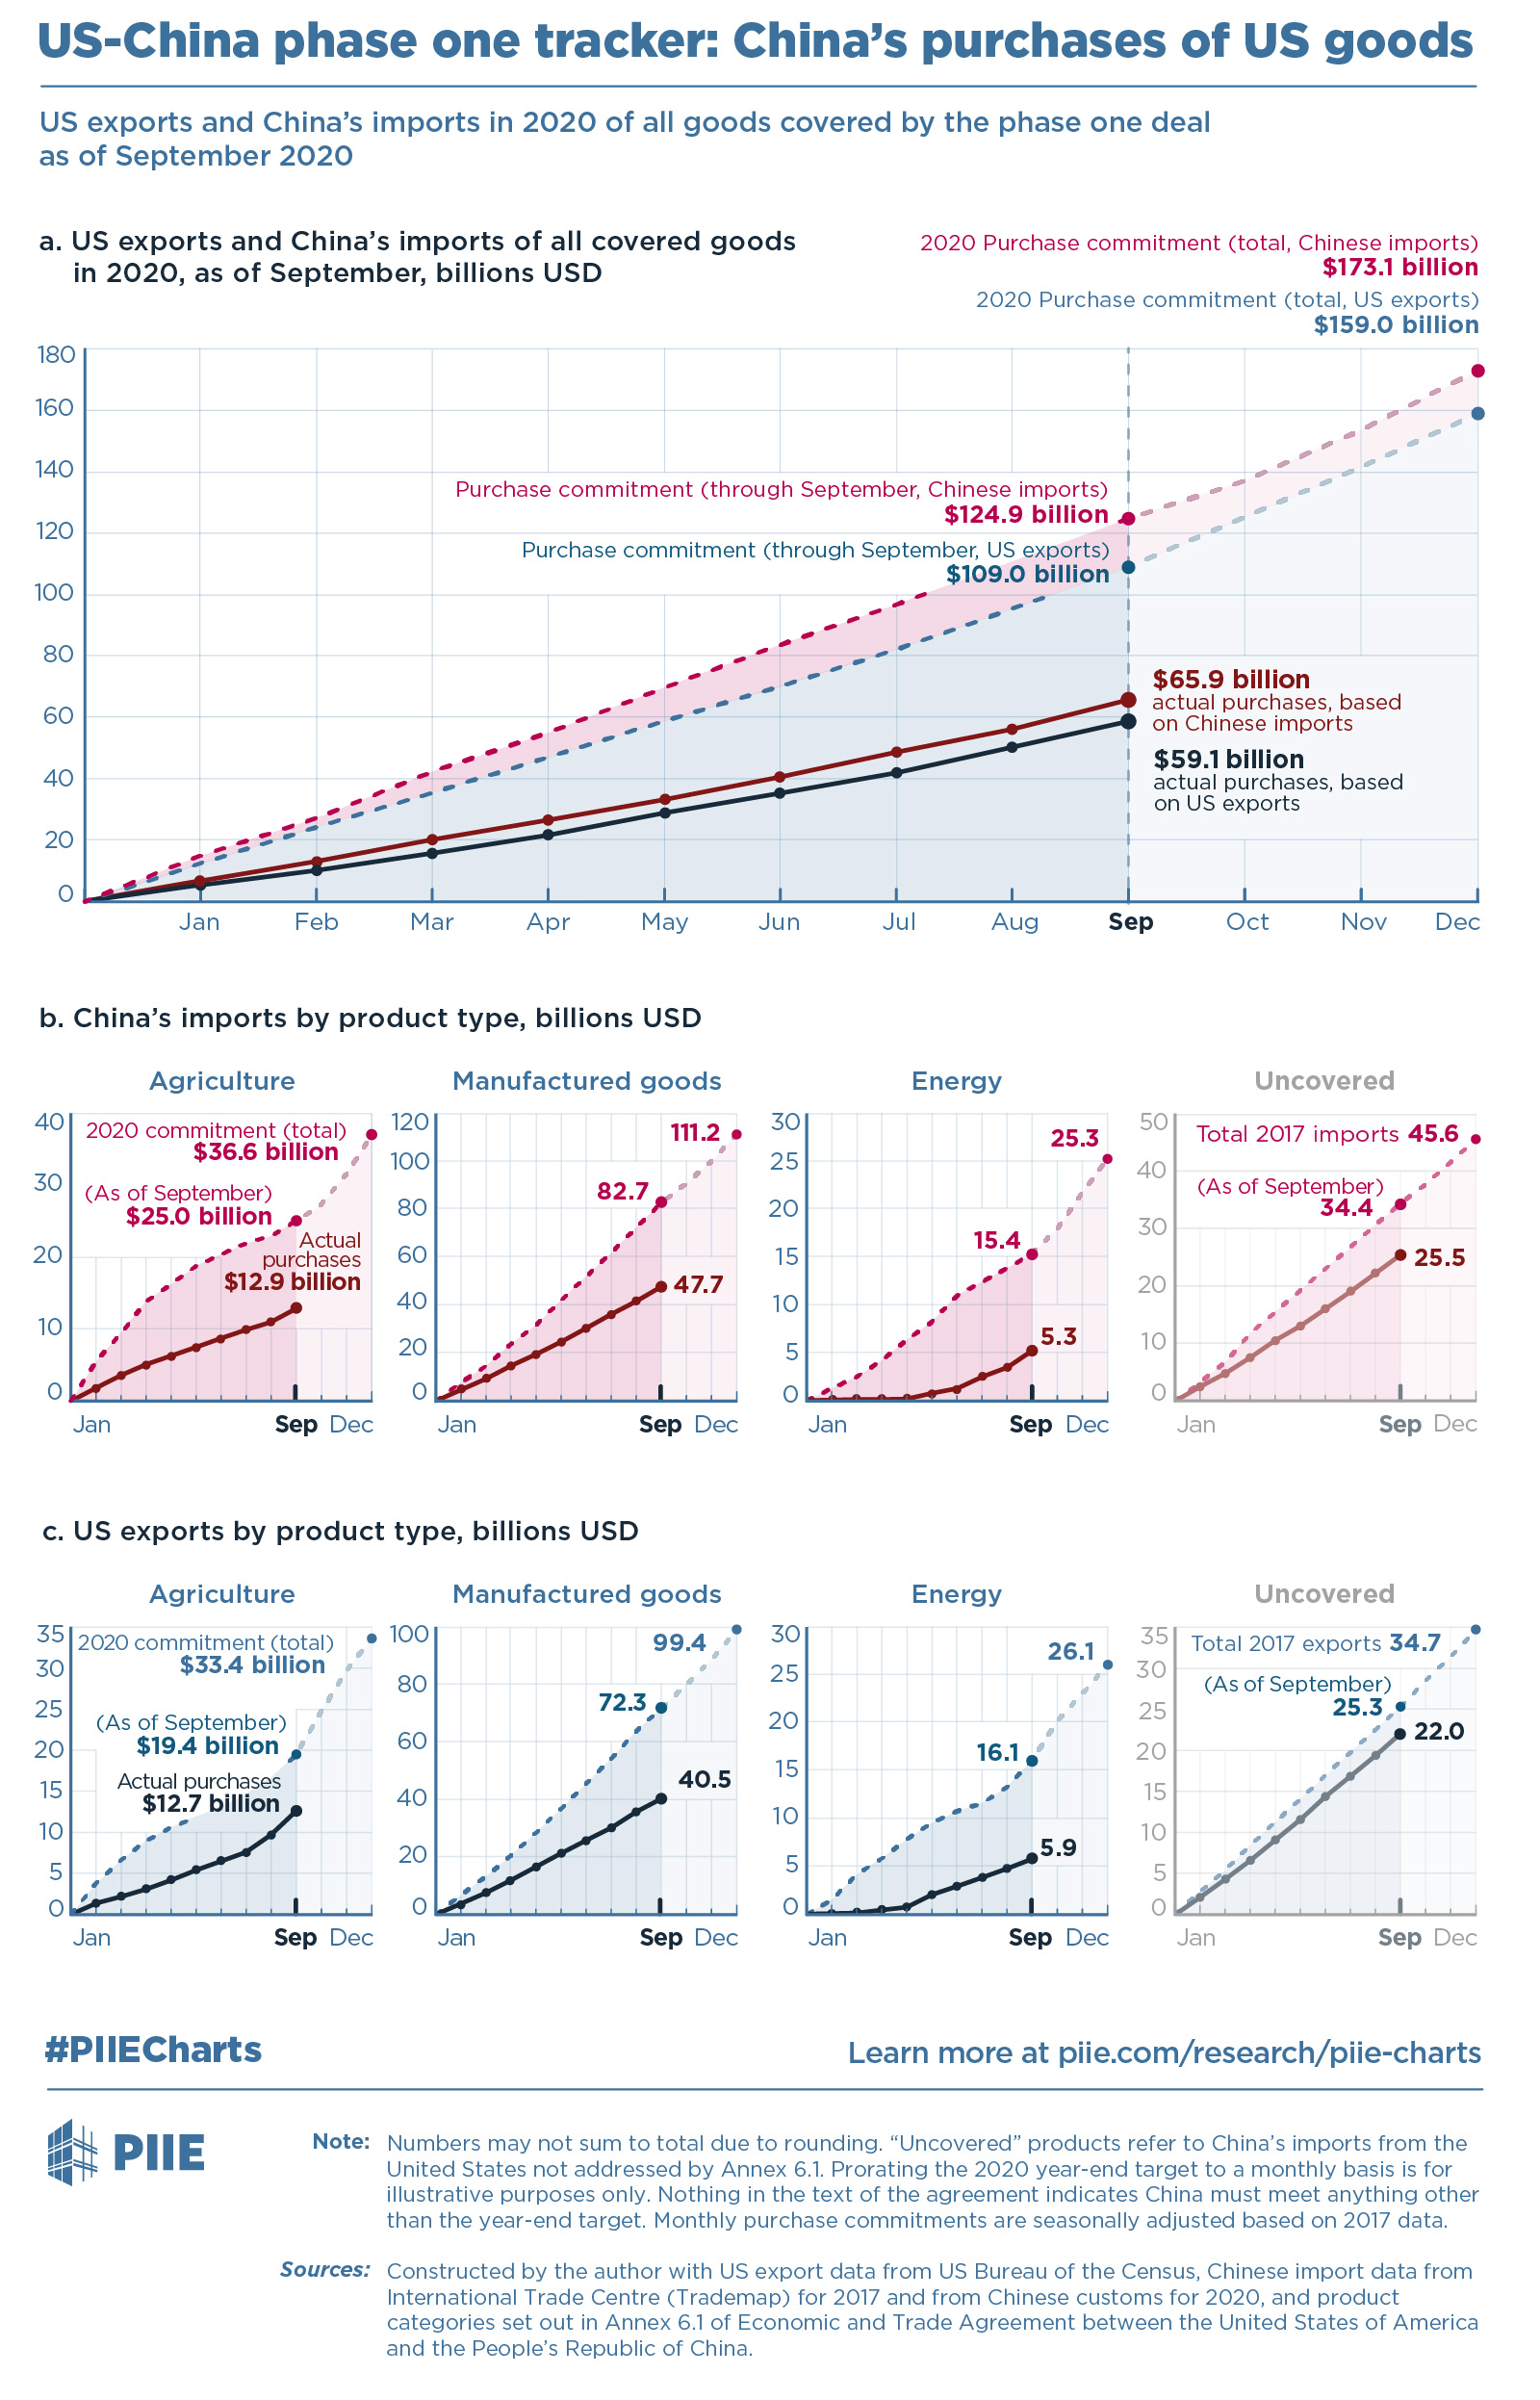
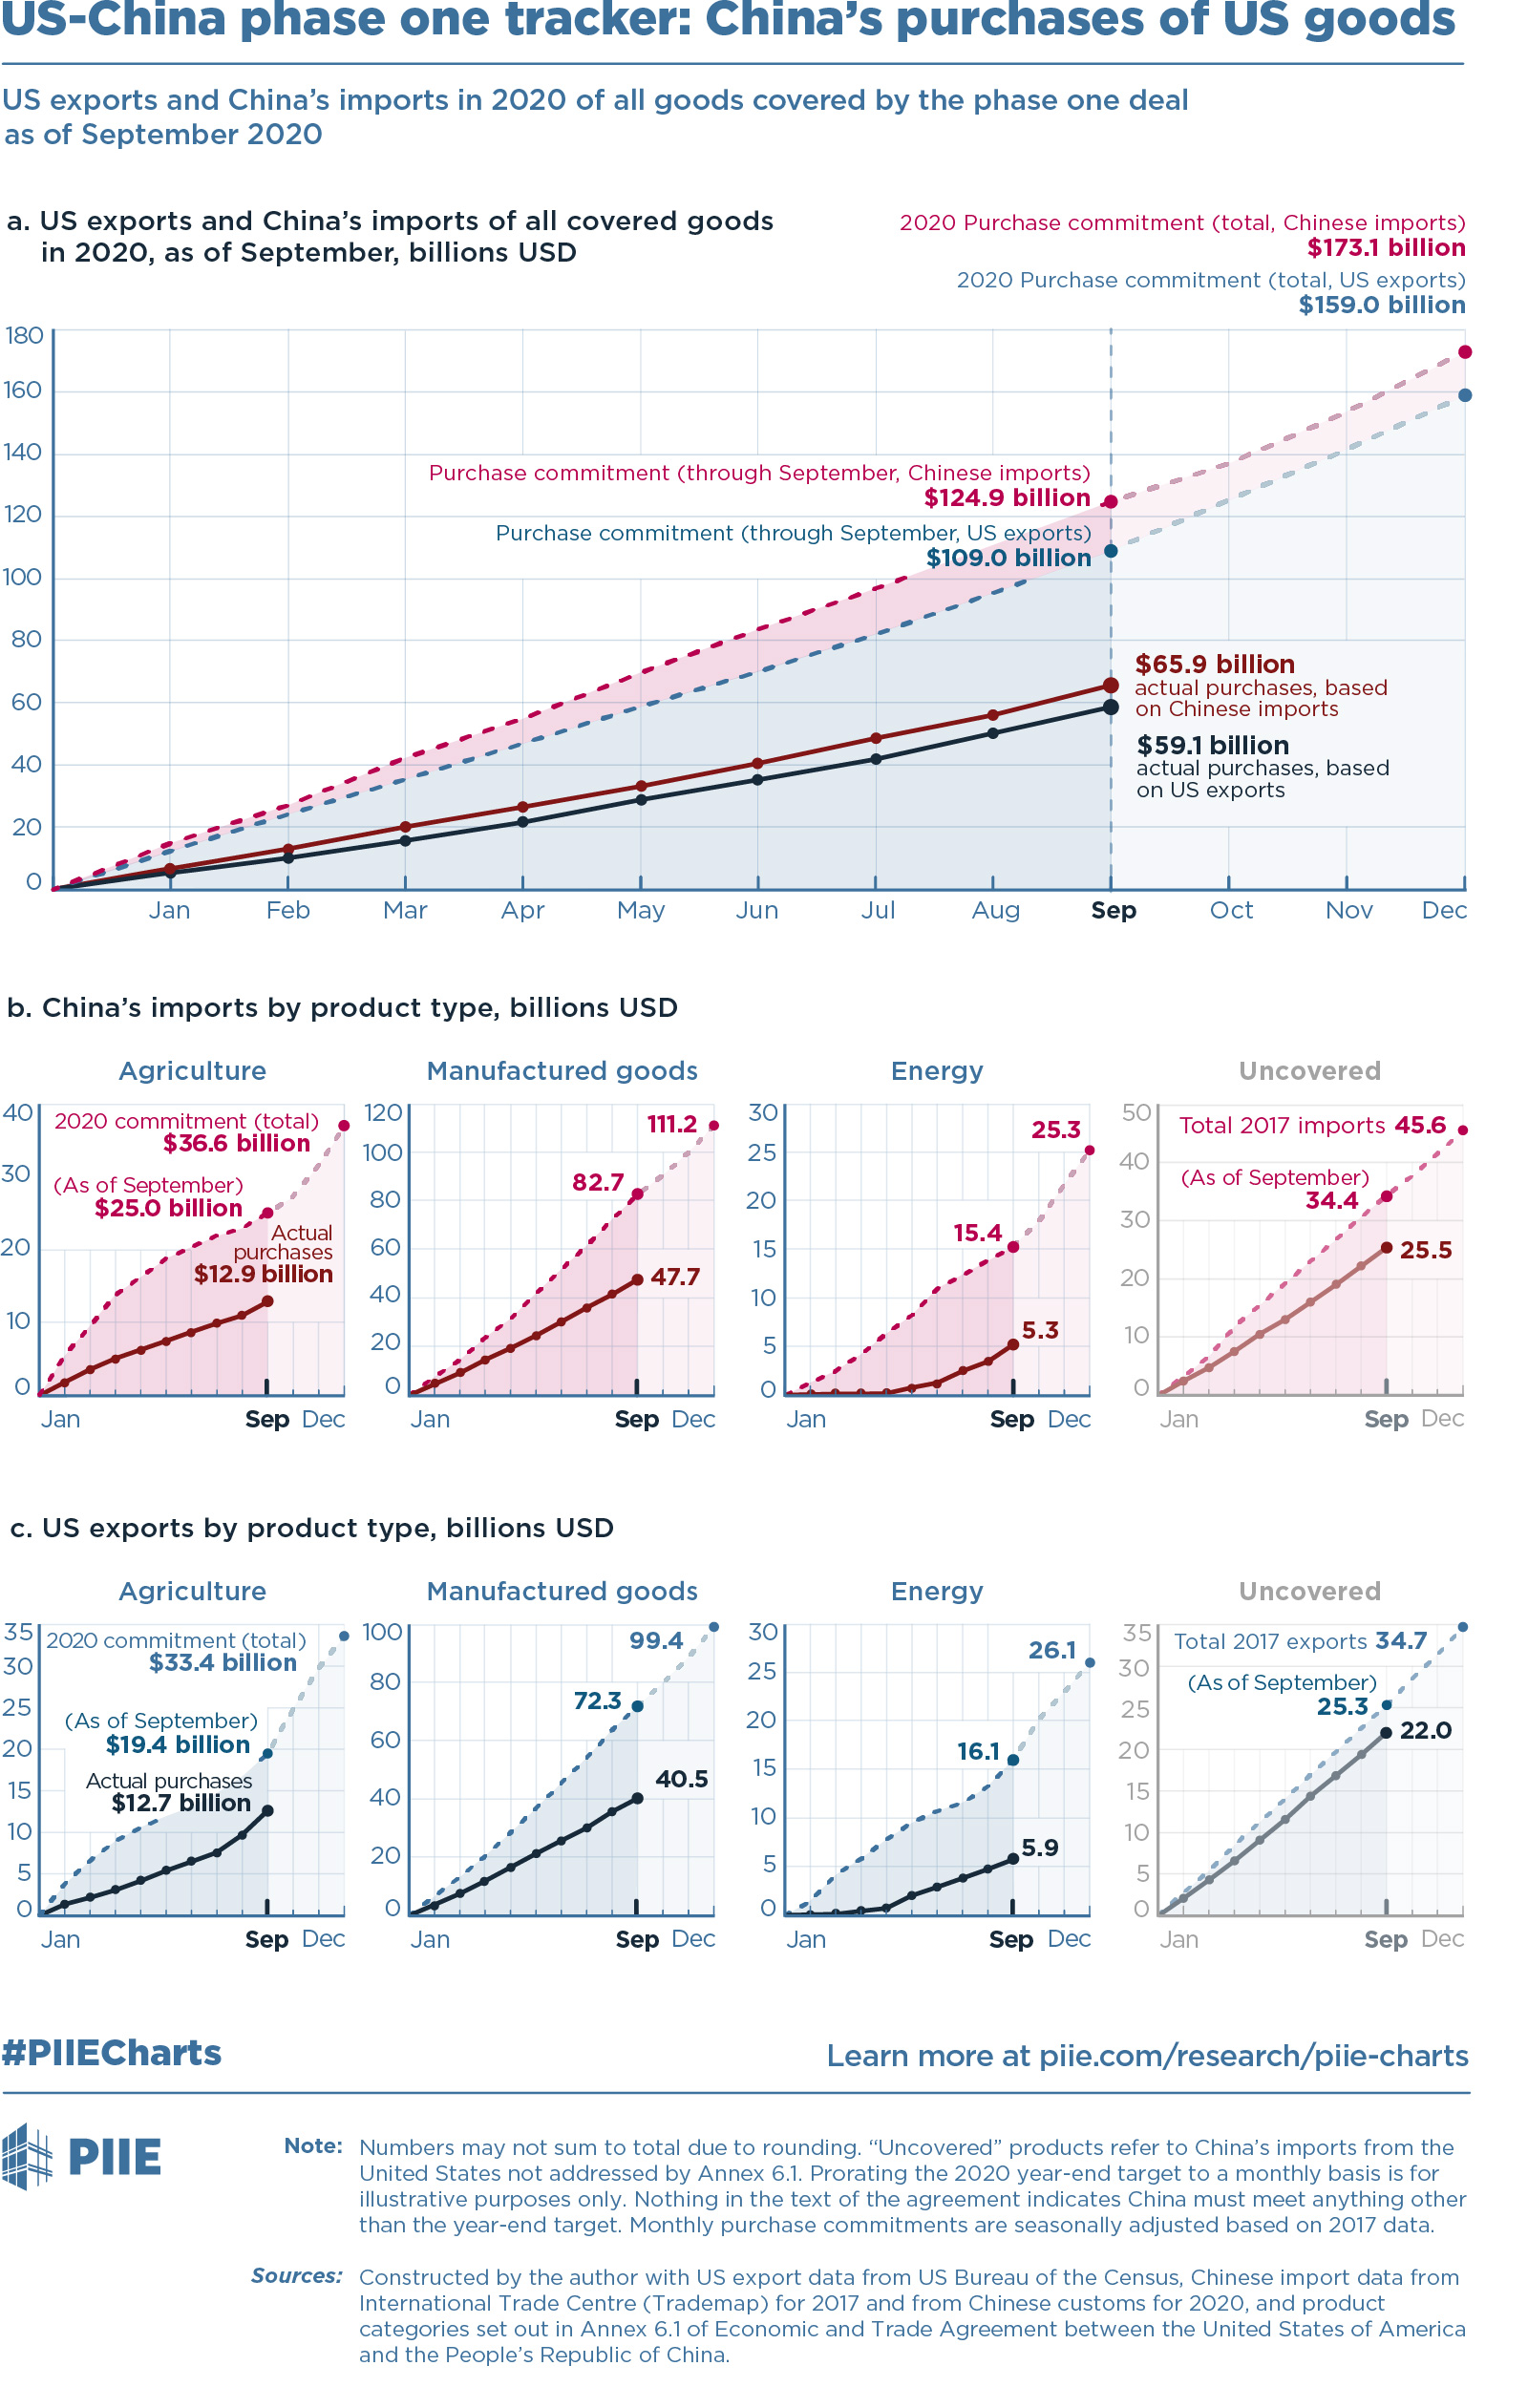
Phase One Deal Tracker
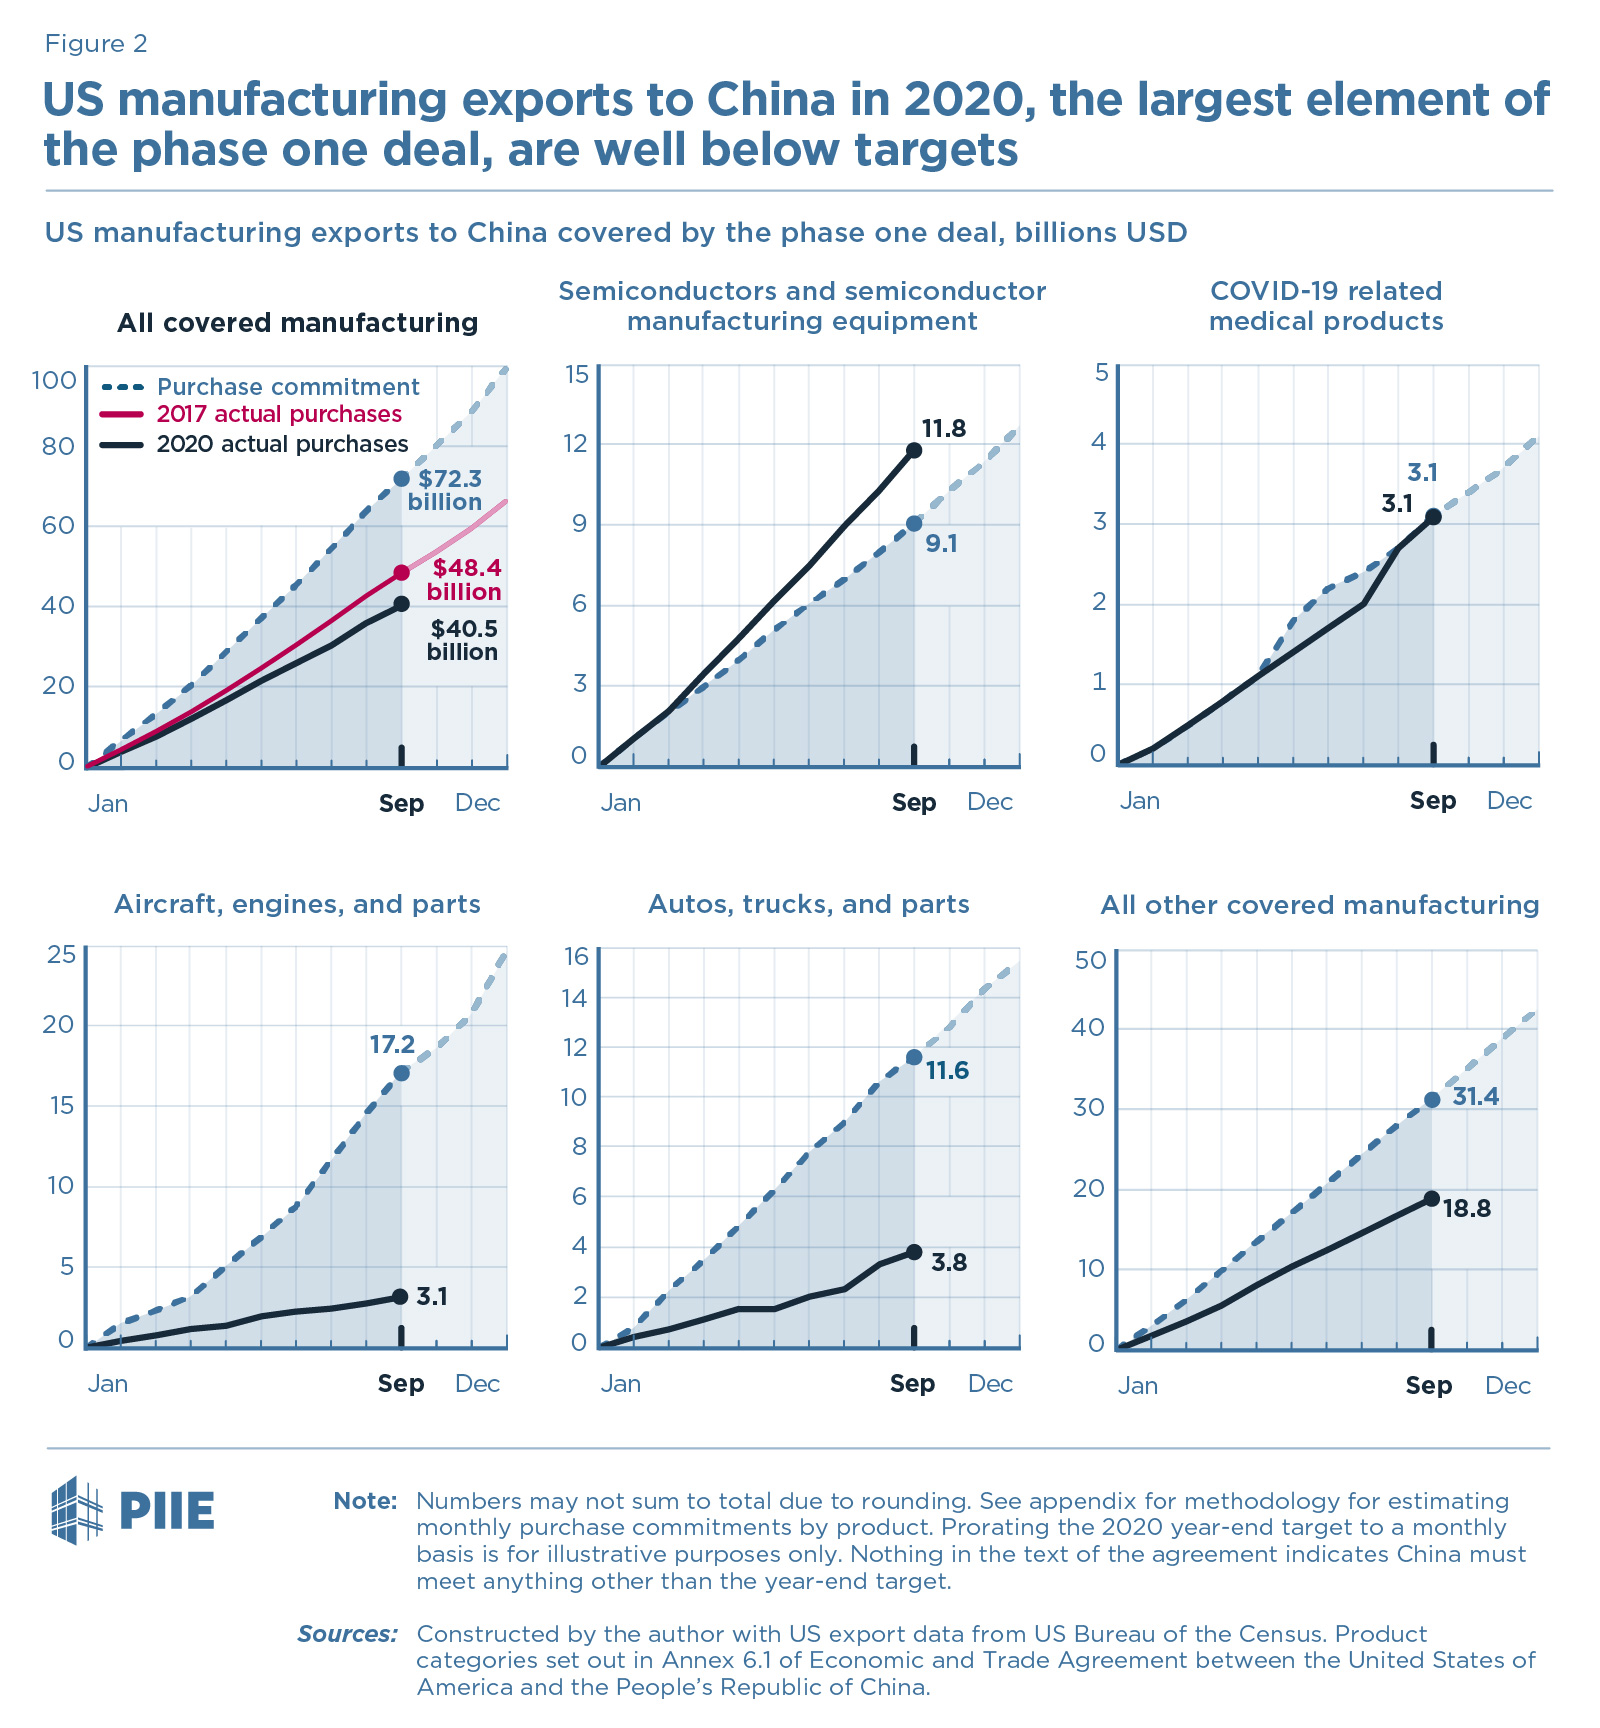
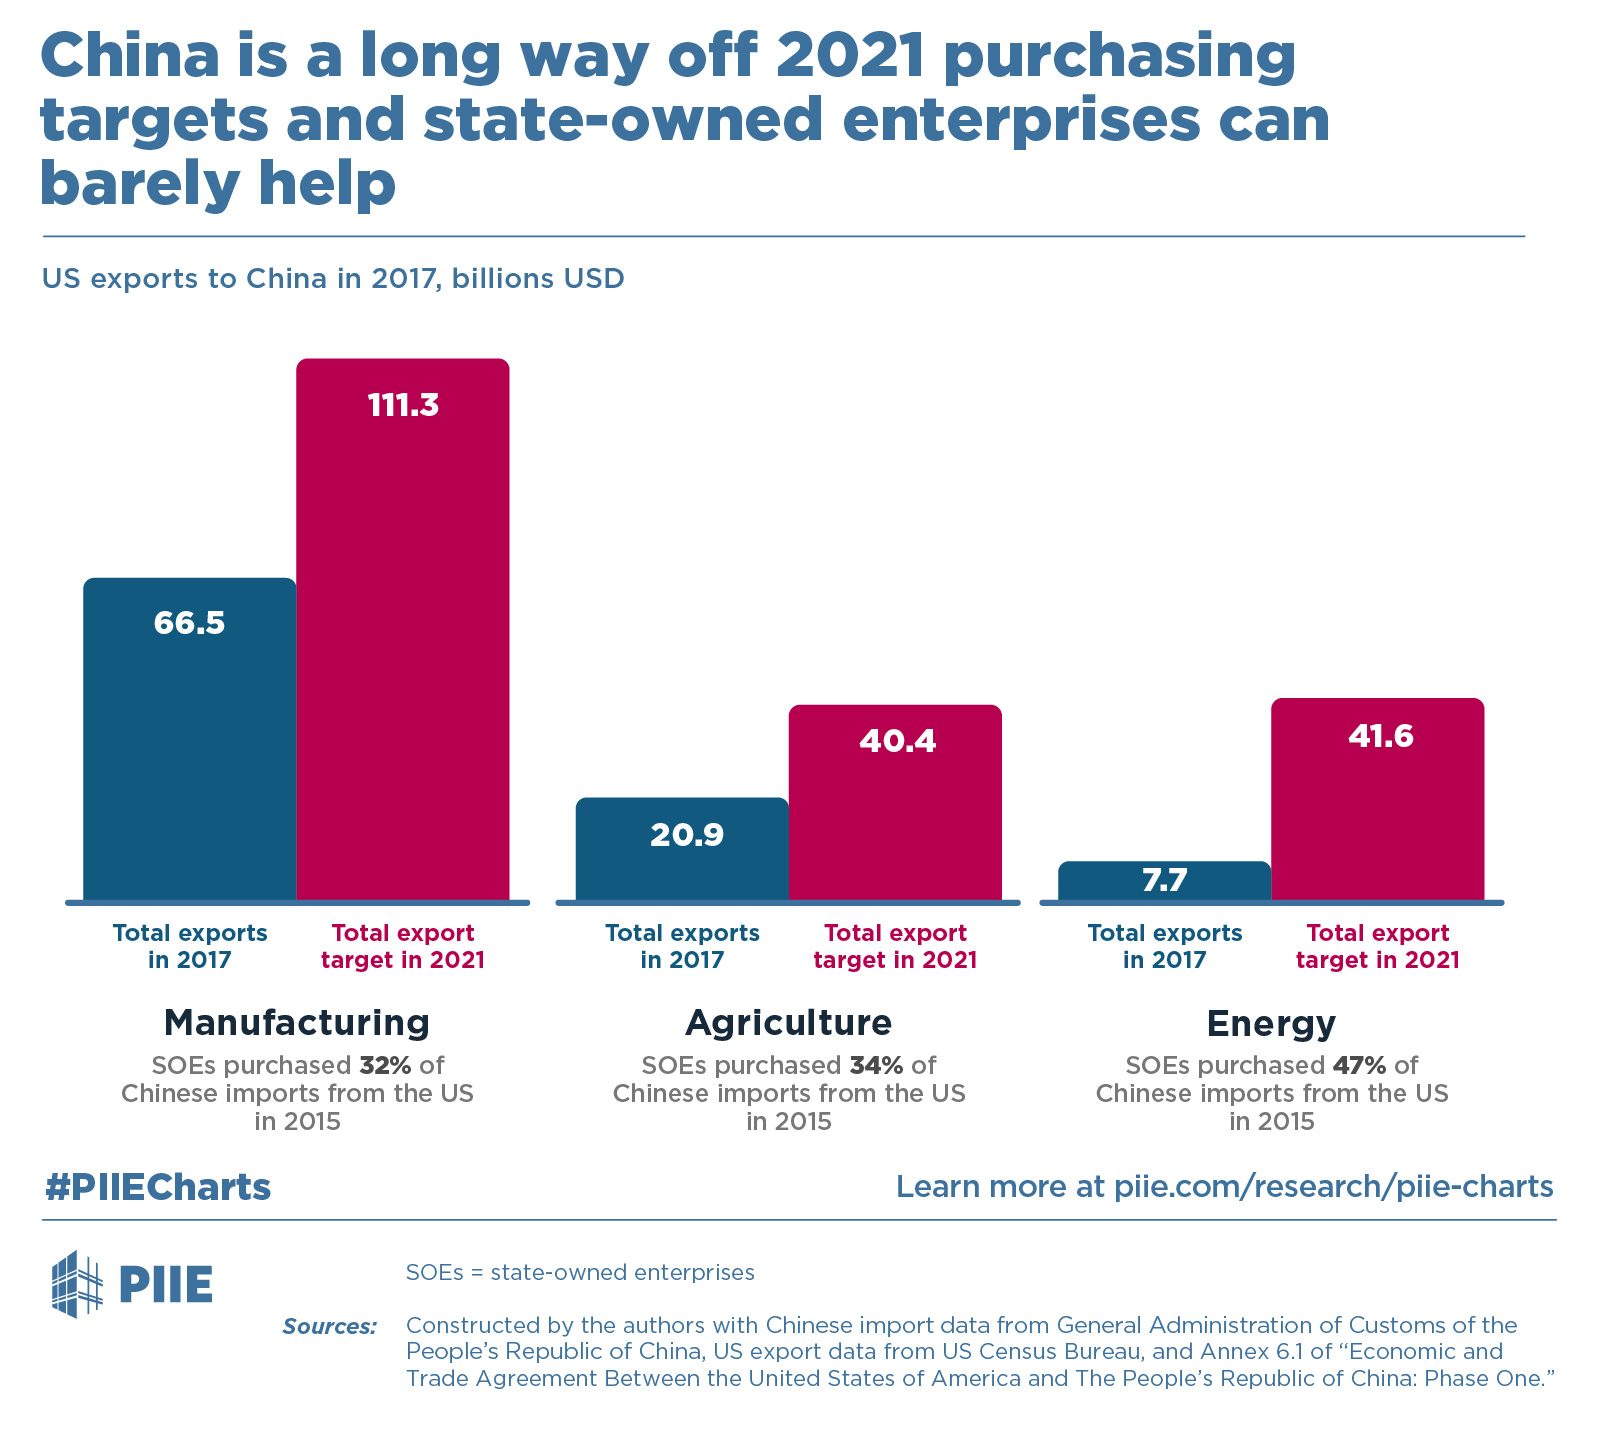
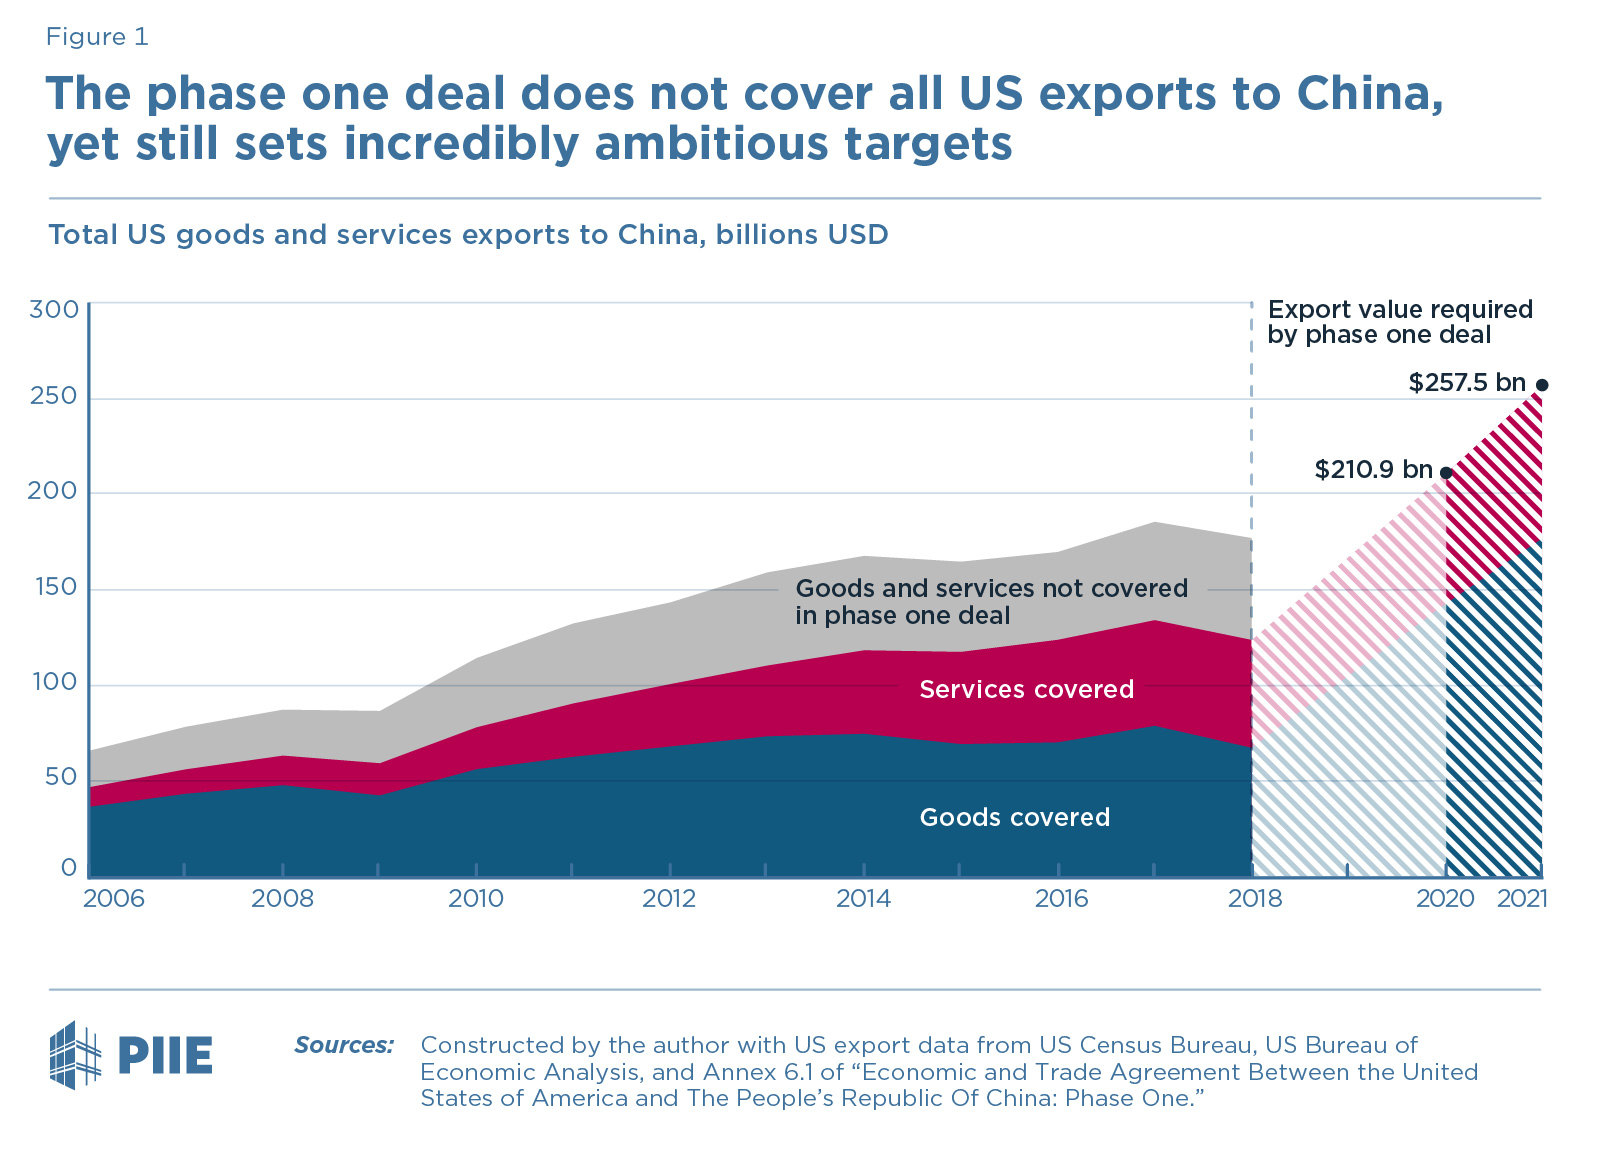
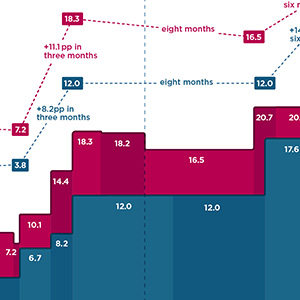
The "Phase One Agreement" signed at the end of 2019 was supposedly a major turning point the US China trade war. The agreement did end the escalation of tariffs on US and Chinese goods. However, the existing, historically high, tariff rates remained in place. Other aspects of the deal, such as Chinese purchase agreements on US goods, largely came to nothing as the COVID pandemic took center-stage in both domestic and international politics. To highlight the unrealistic targets and impossibility of Chinese businesses meeting the terms of the agreement, we created a series of charts that tracked Chinese imports from the US and compared that to the imports China would need to purchase to make its Phase One Deal purchase commitments. The chart was updated monthly and charted the increasing disparity between the purchase targets and actual Chinese purchases.
The Mission:
Produce a periodically updated series of charts to illustrate China's actual purchases from the US as compared to its purchase commitments under the Phase One Agreement.
The Client:
Peterson Institute
The Time:
Early 2020 - Present
My Role:
Concept Development, Graphic Design, Production
Other Credits
Steve Weisman: Creative Direction
Melina Kolb: Creative Direction
Oliver Ward: Development, Copy-writing, Editing
Helen Hillebrand: Copy-editing
Chad Bown: Expert
Hexuan Li: Research
Melina Kolb: Creative Direction
Oliver Ward: Development, Copy-writing, Editing
Helen Hillebrand: Copy-editing
Chad Bown: Expert
Hexuan Li: Research
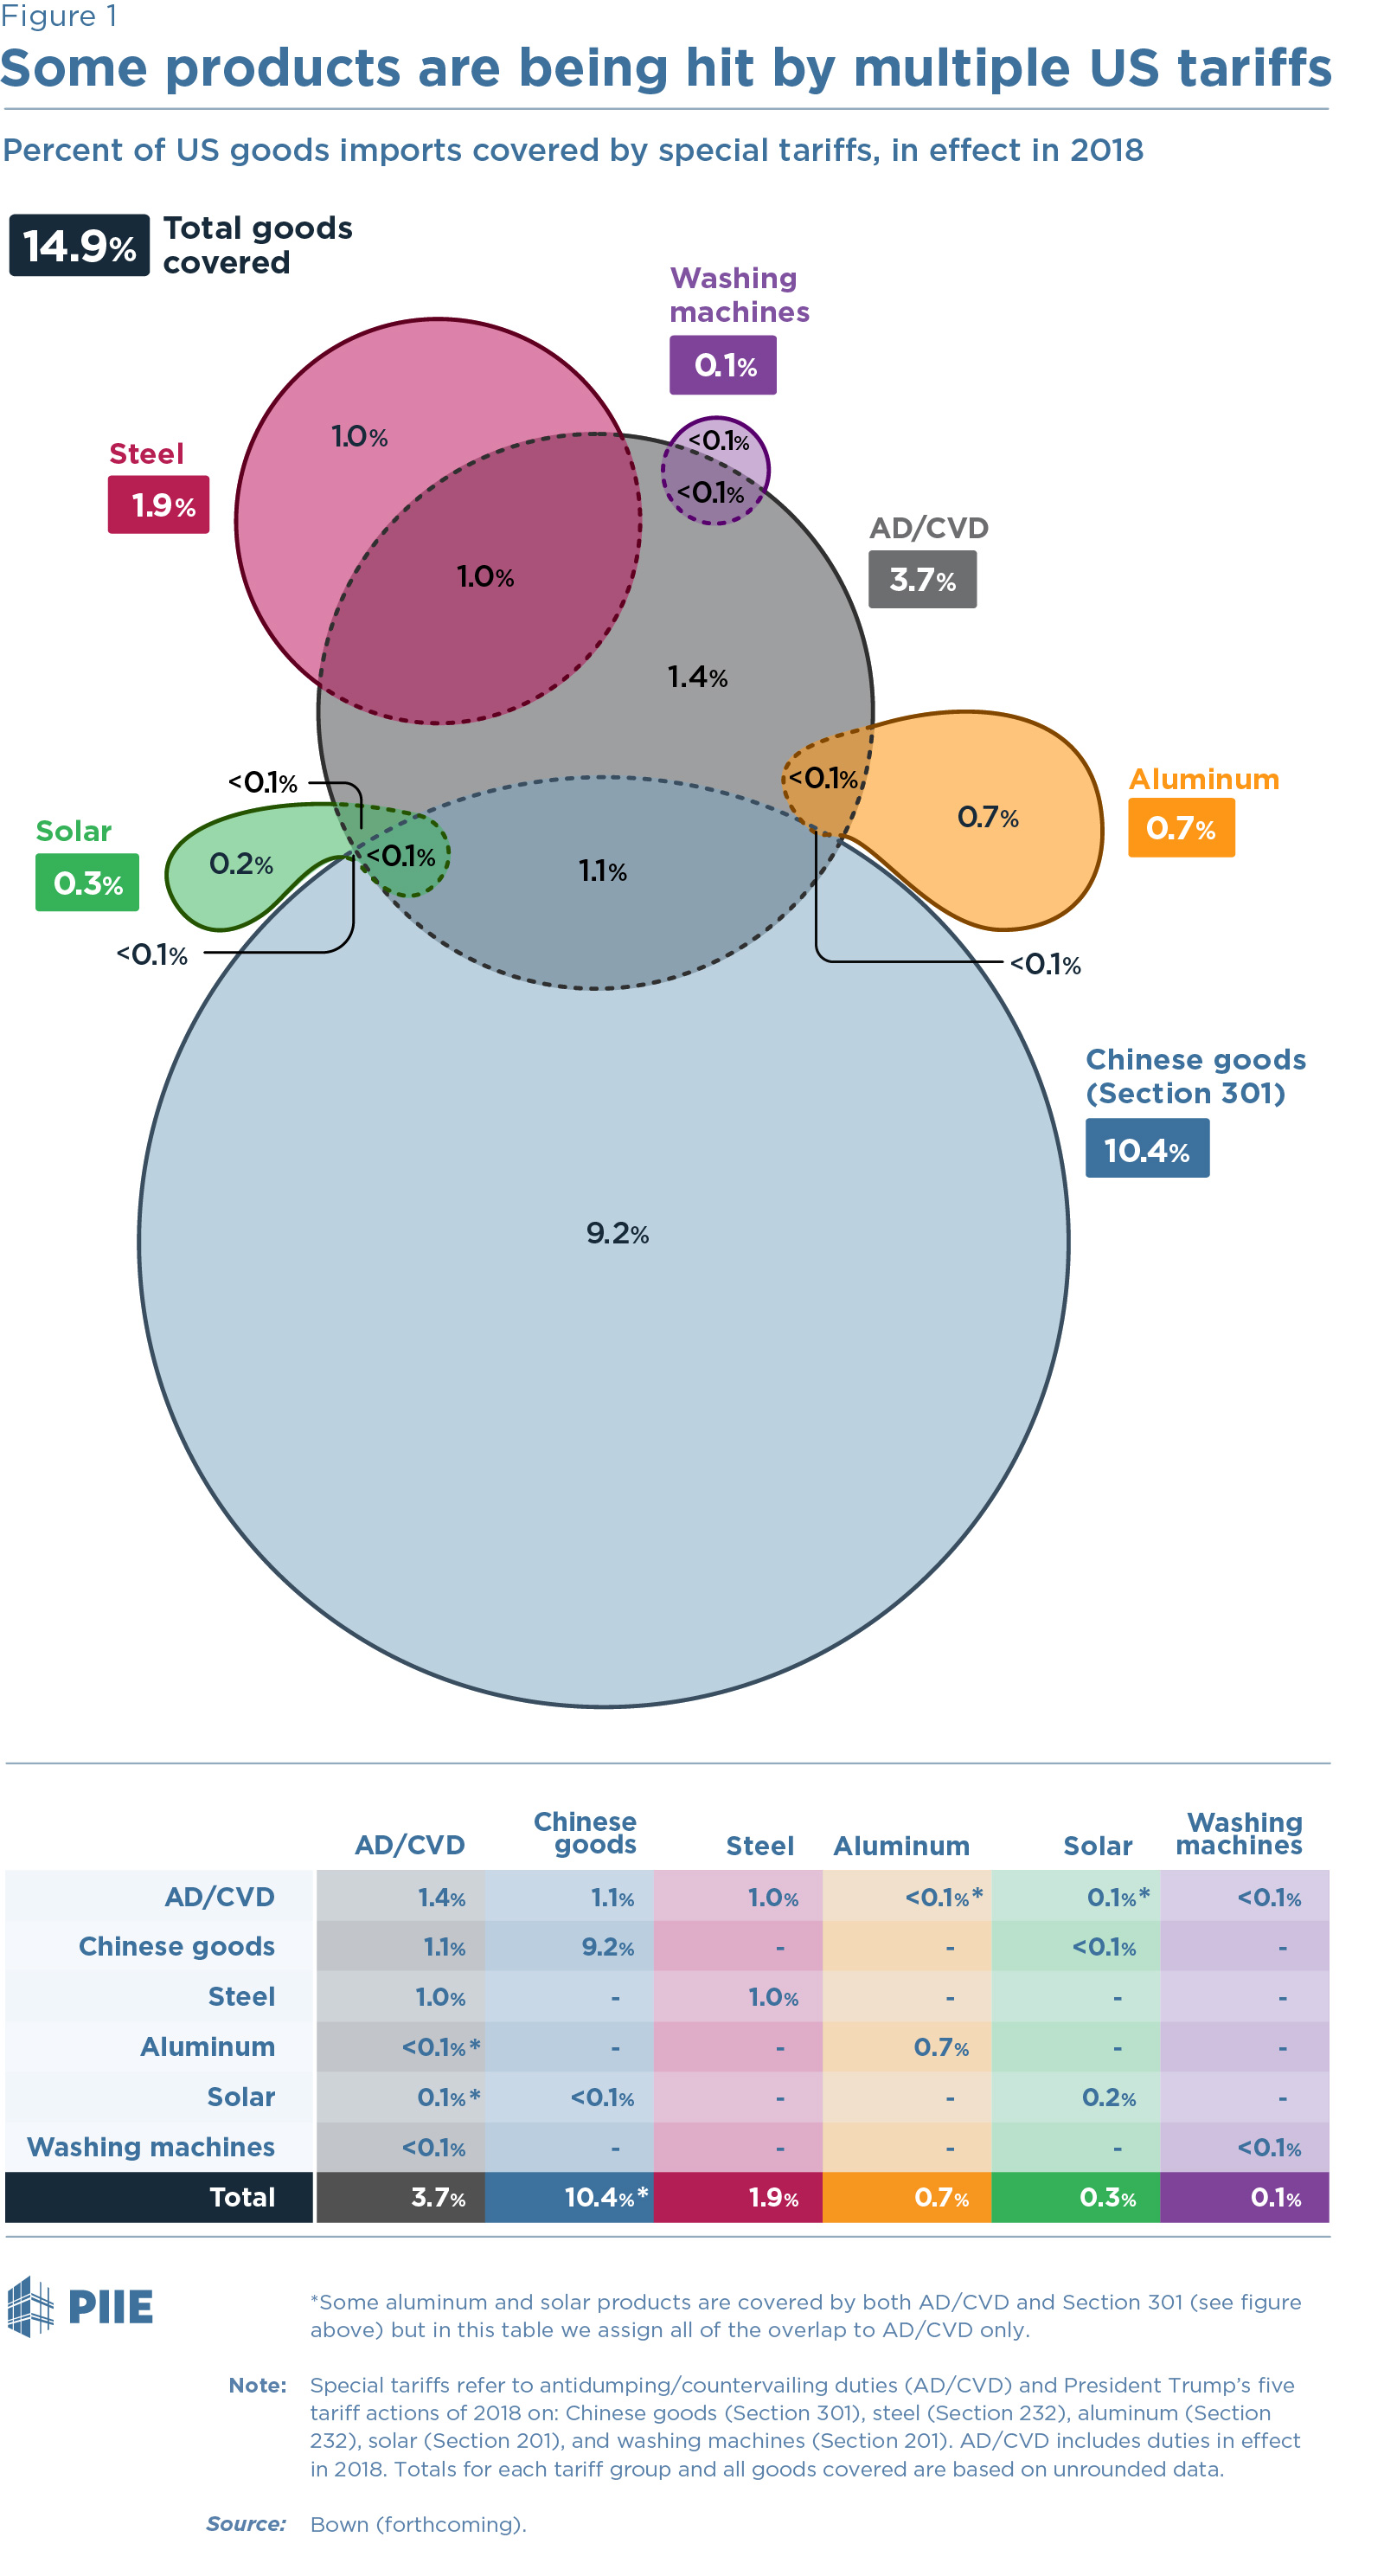
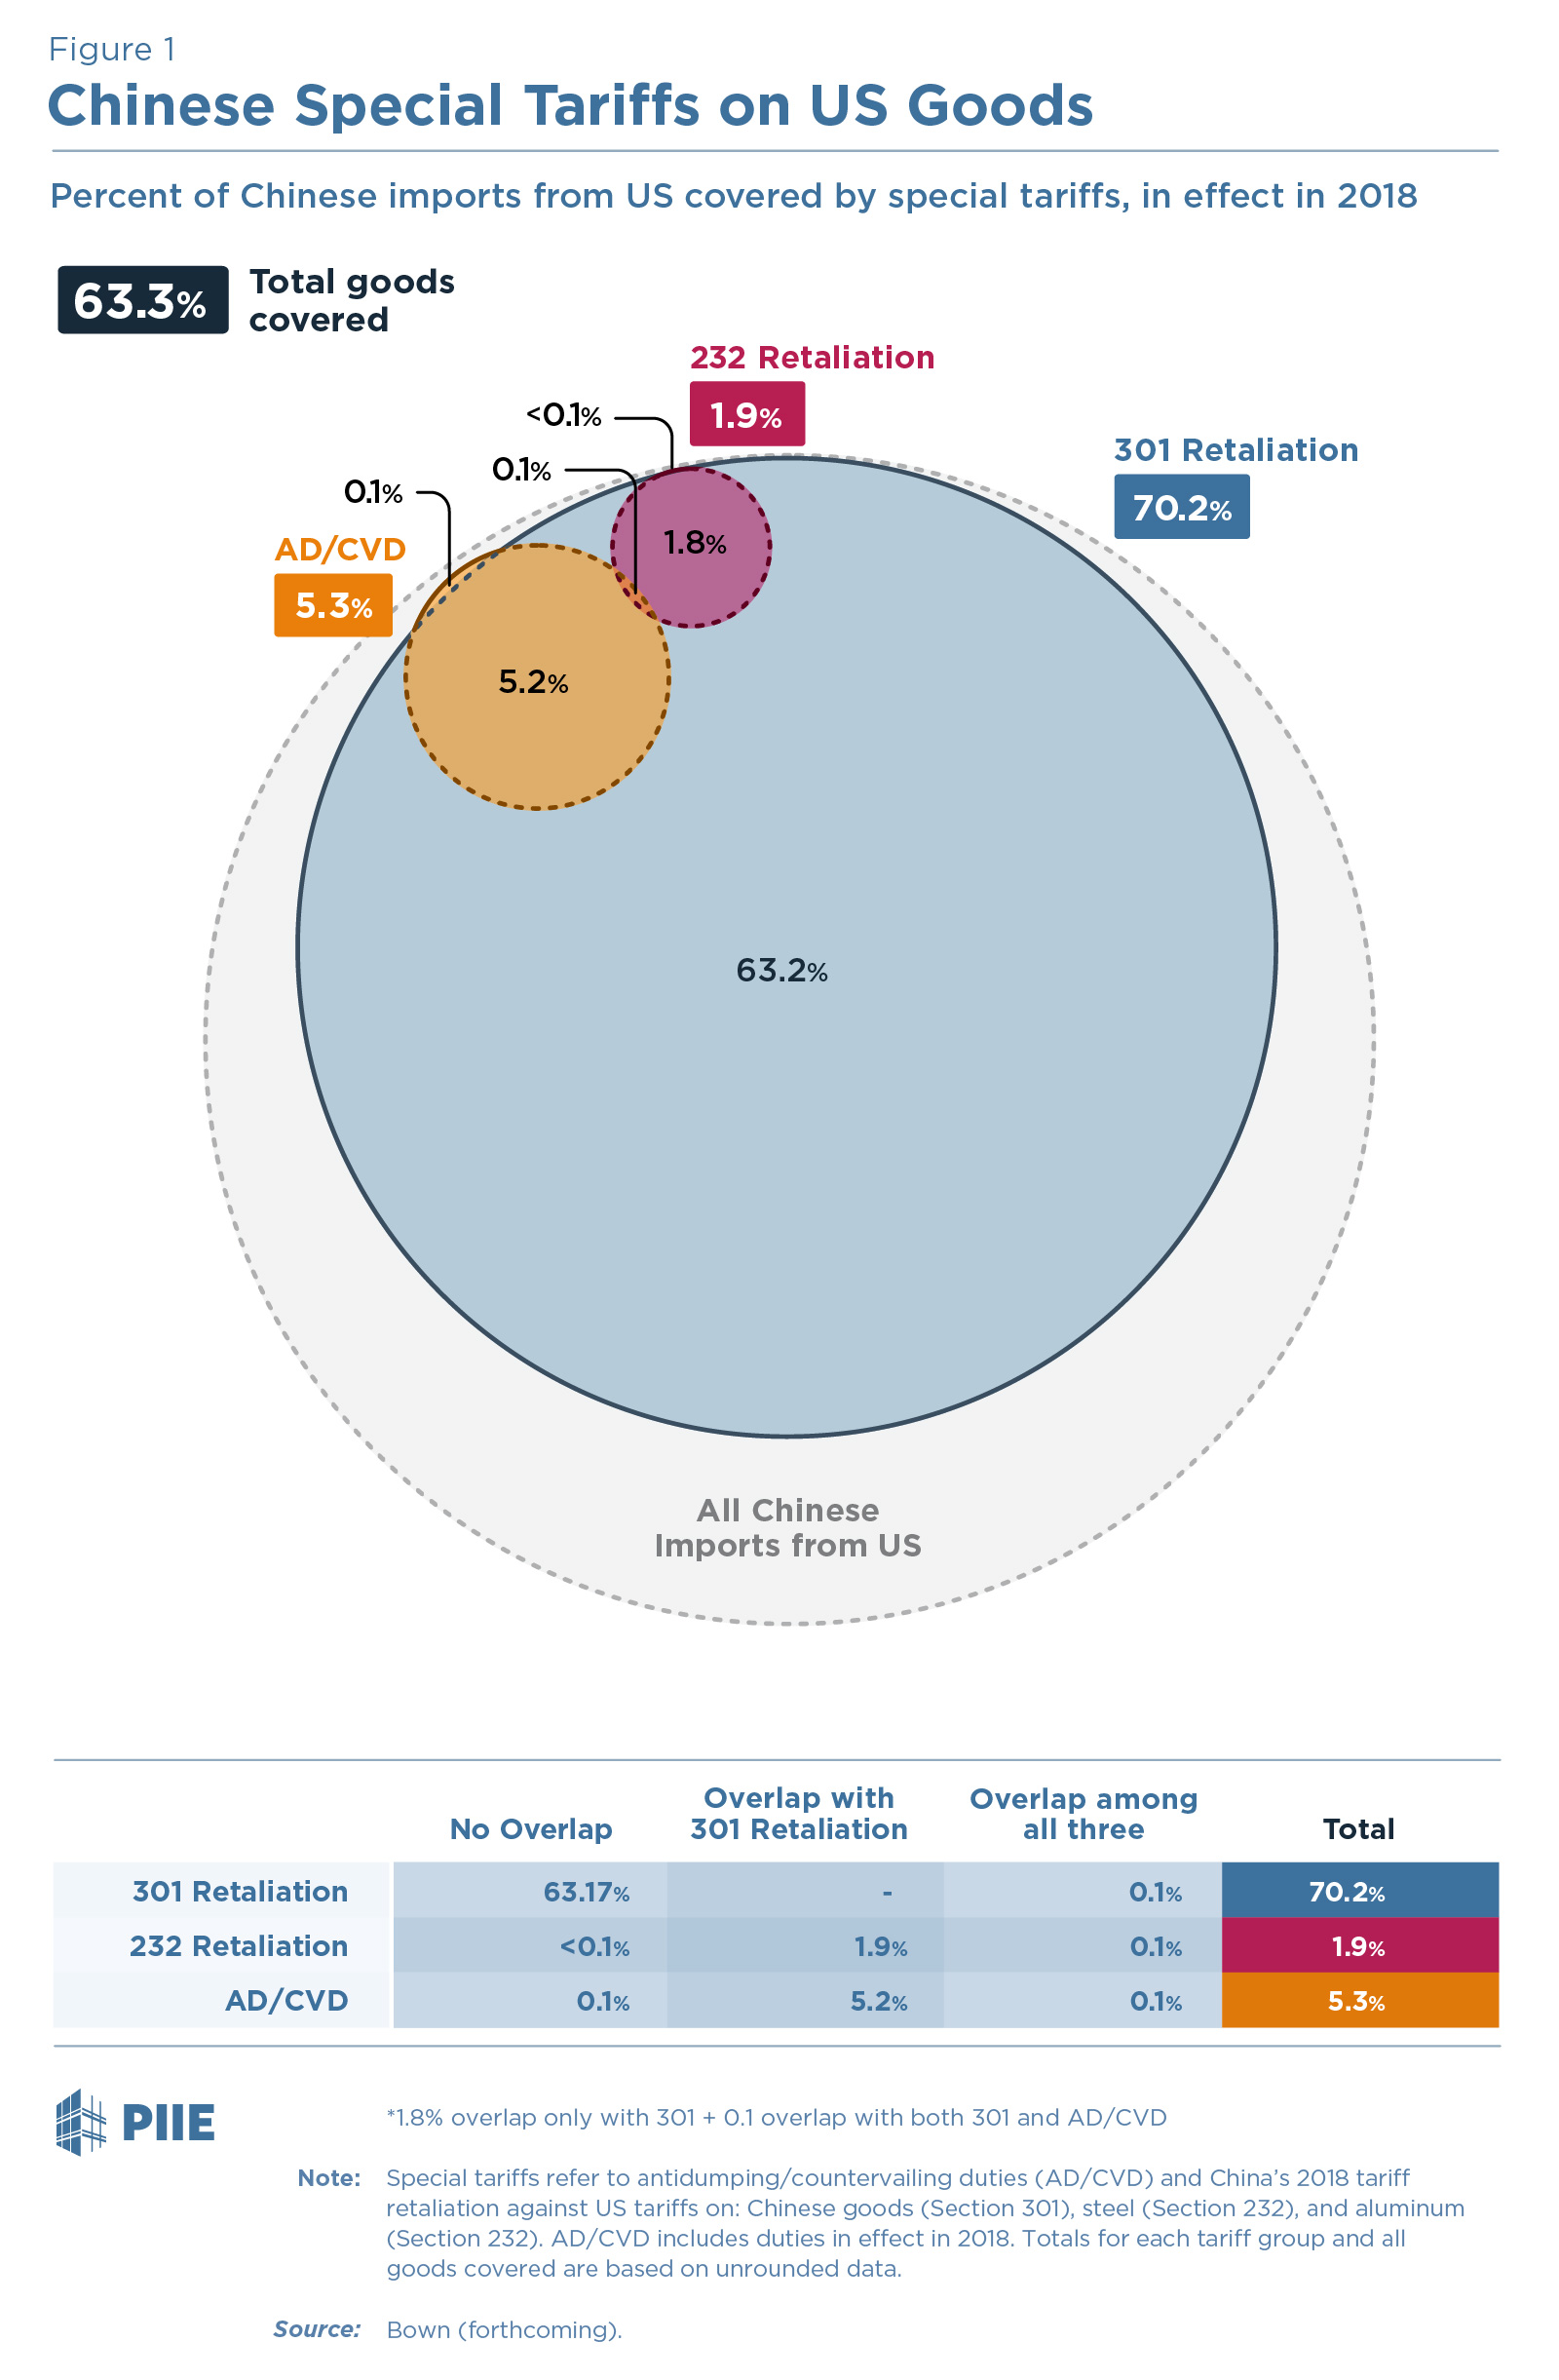
Trade Coverage Venn diagram
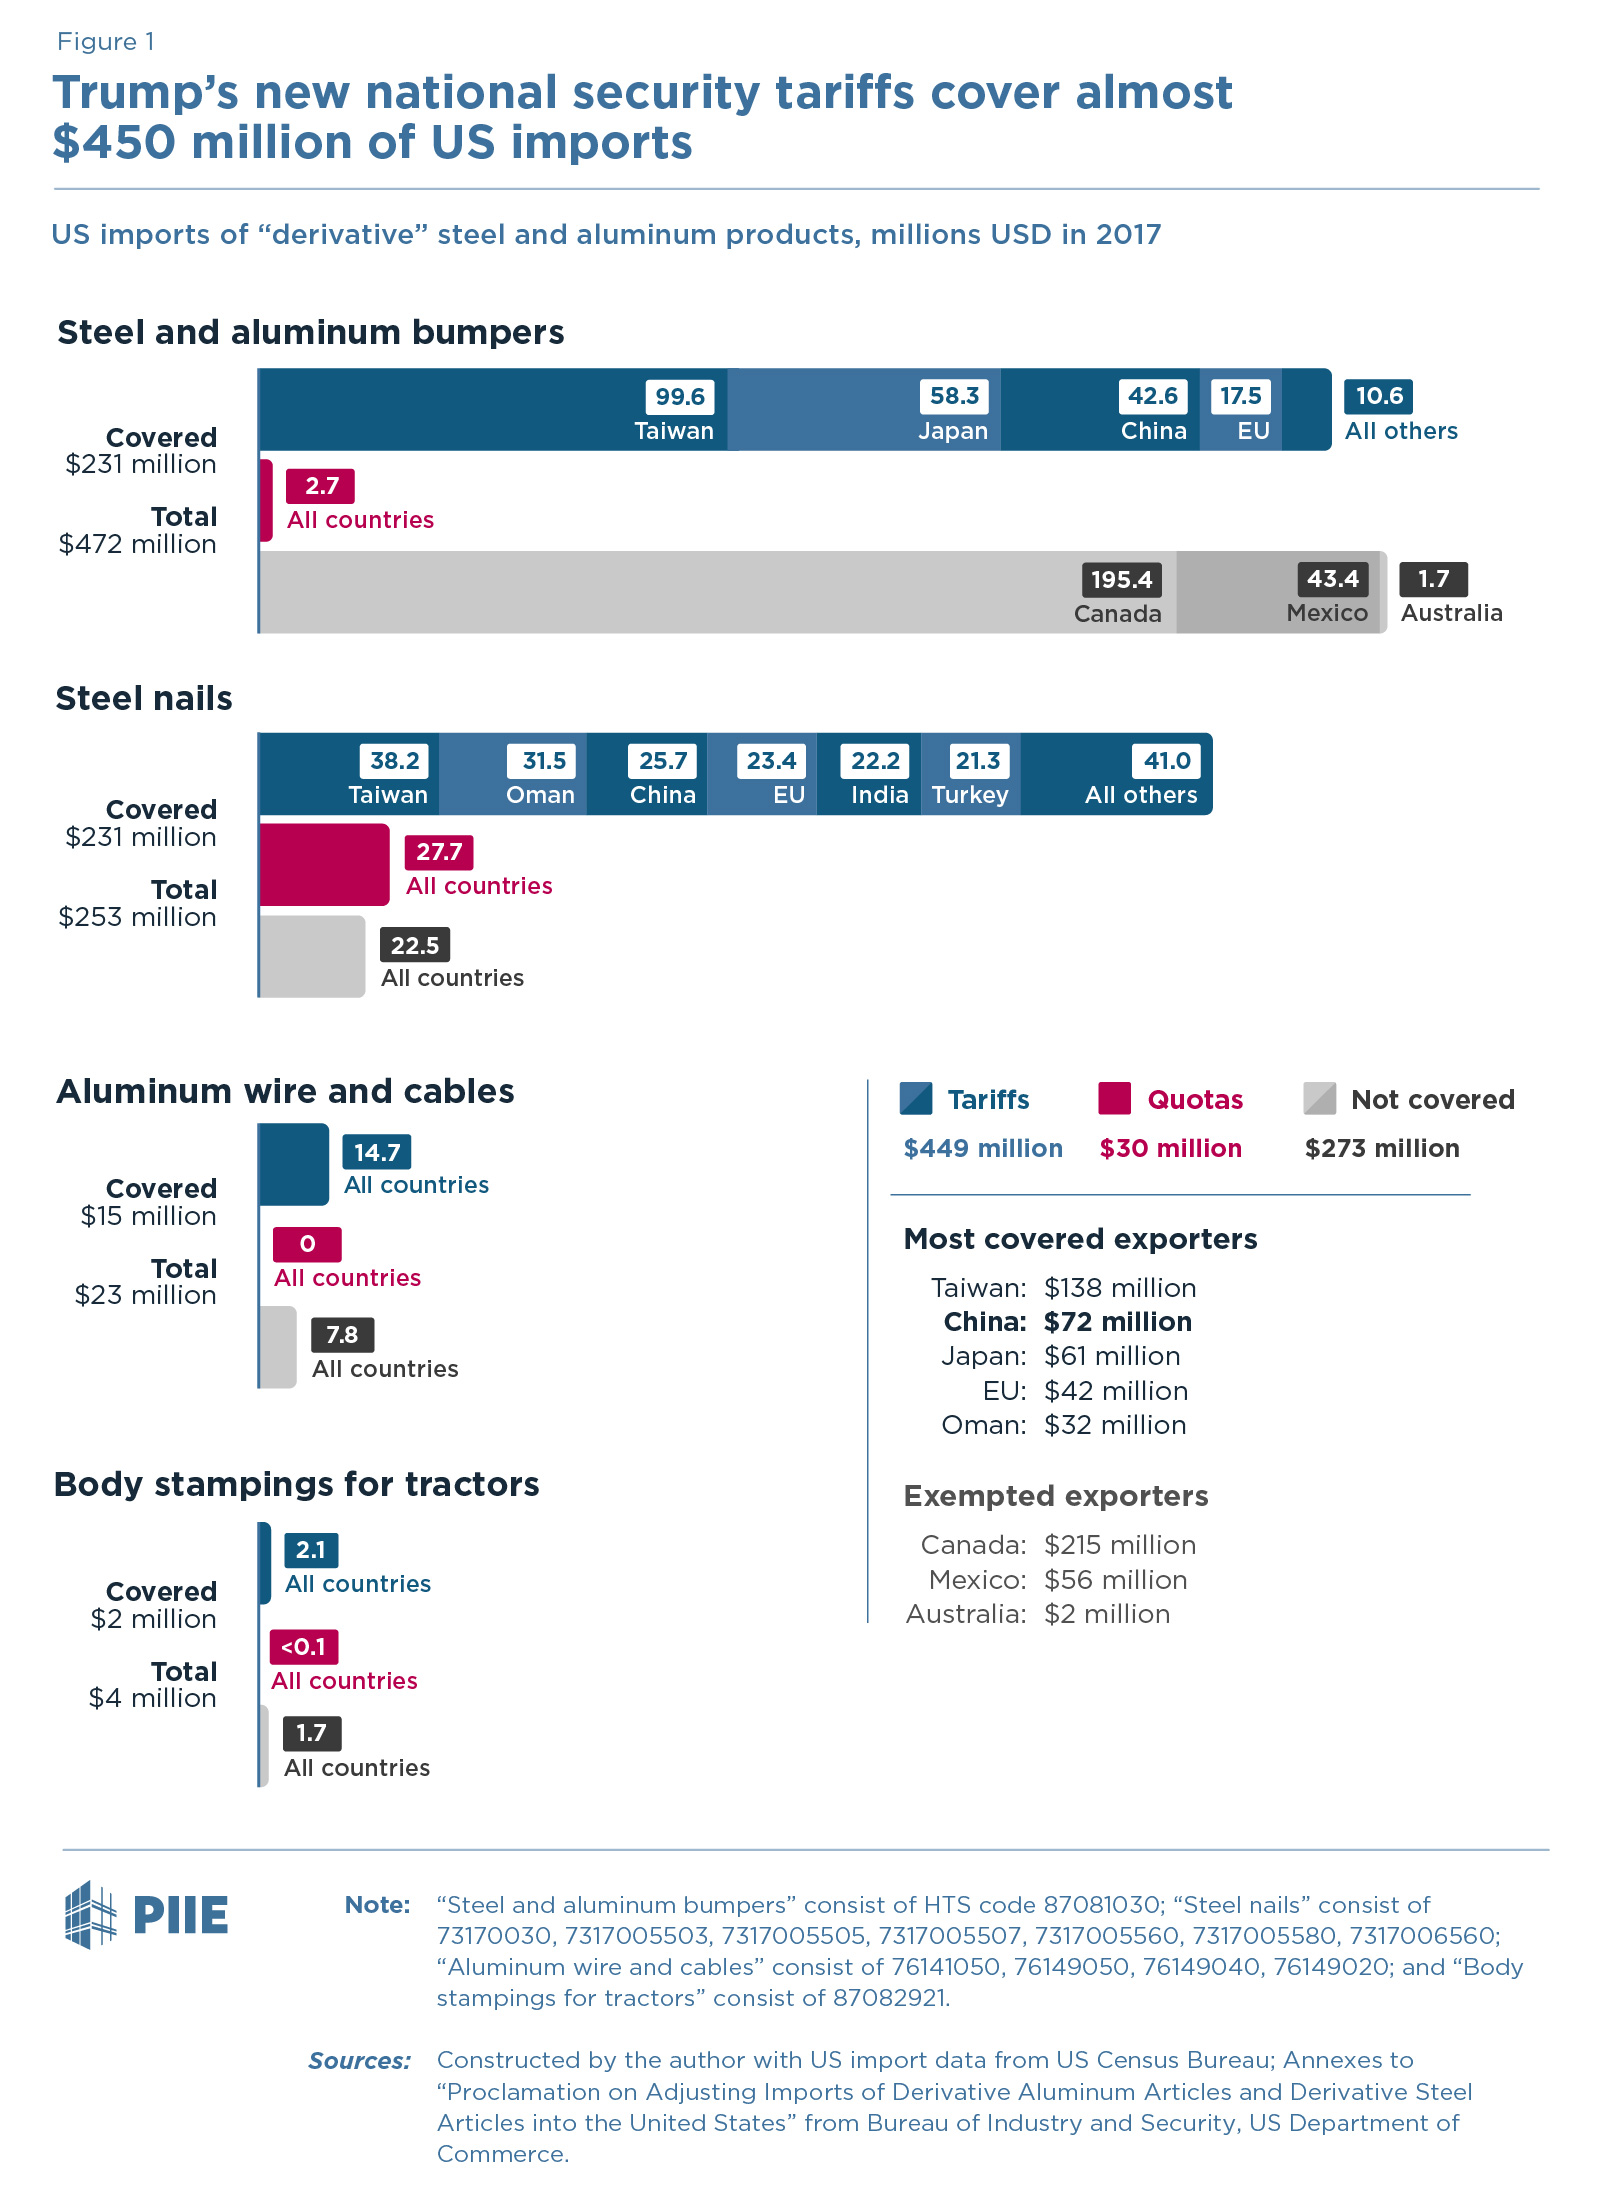
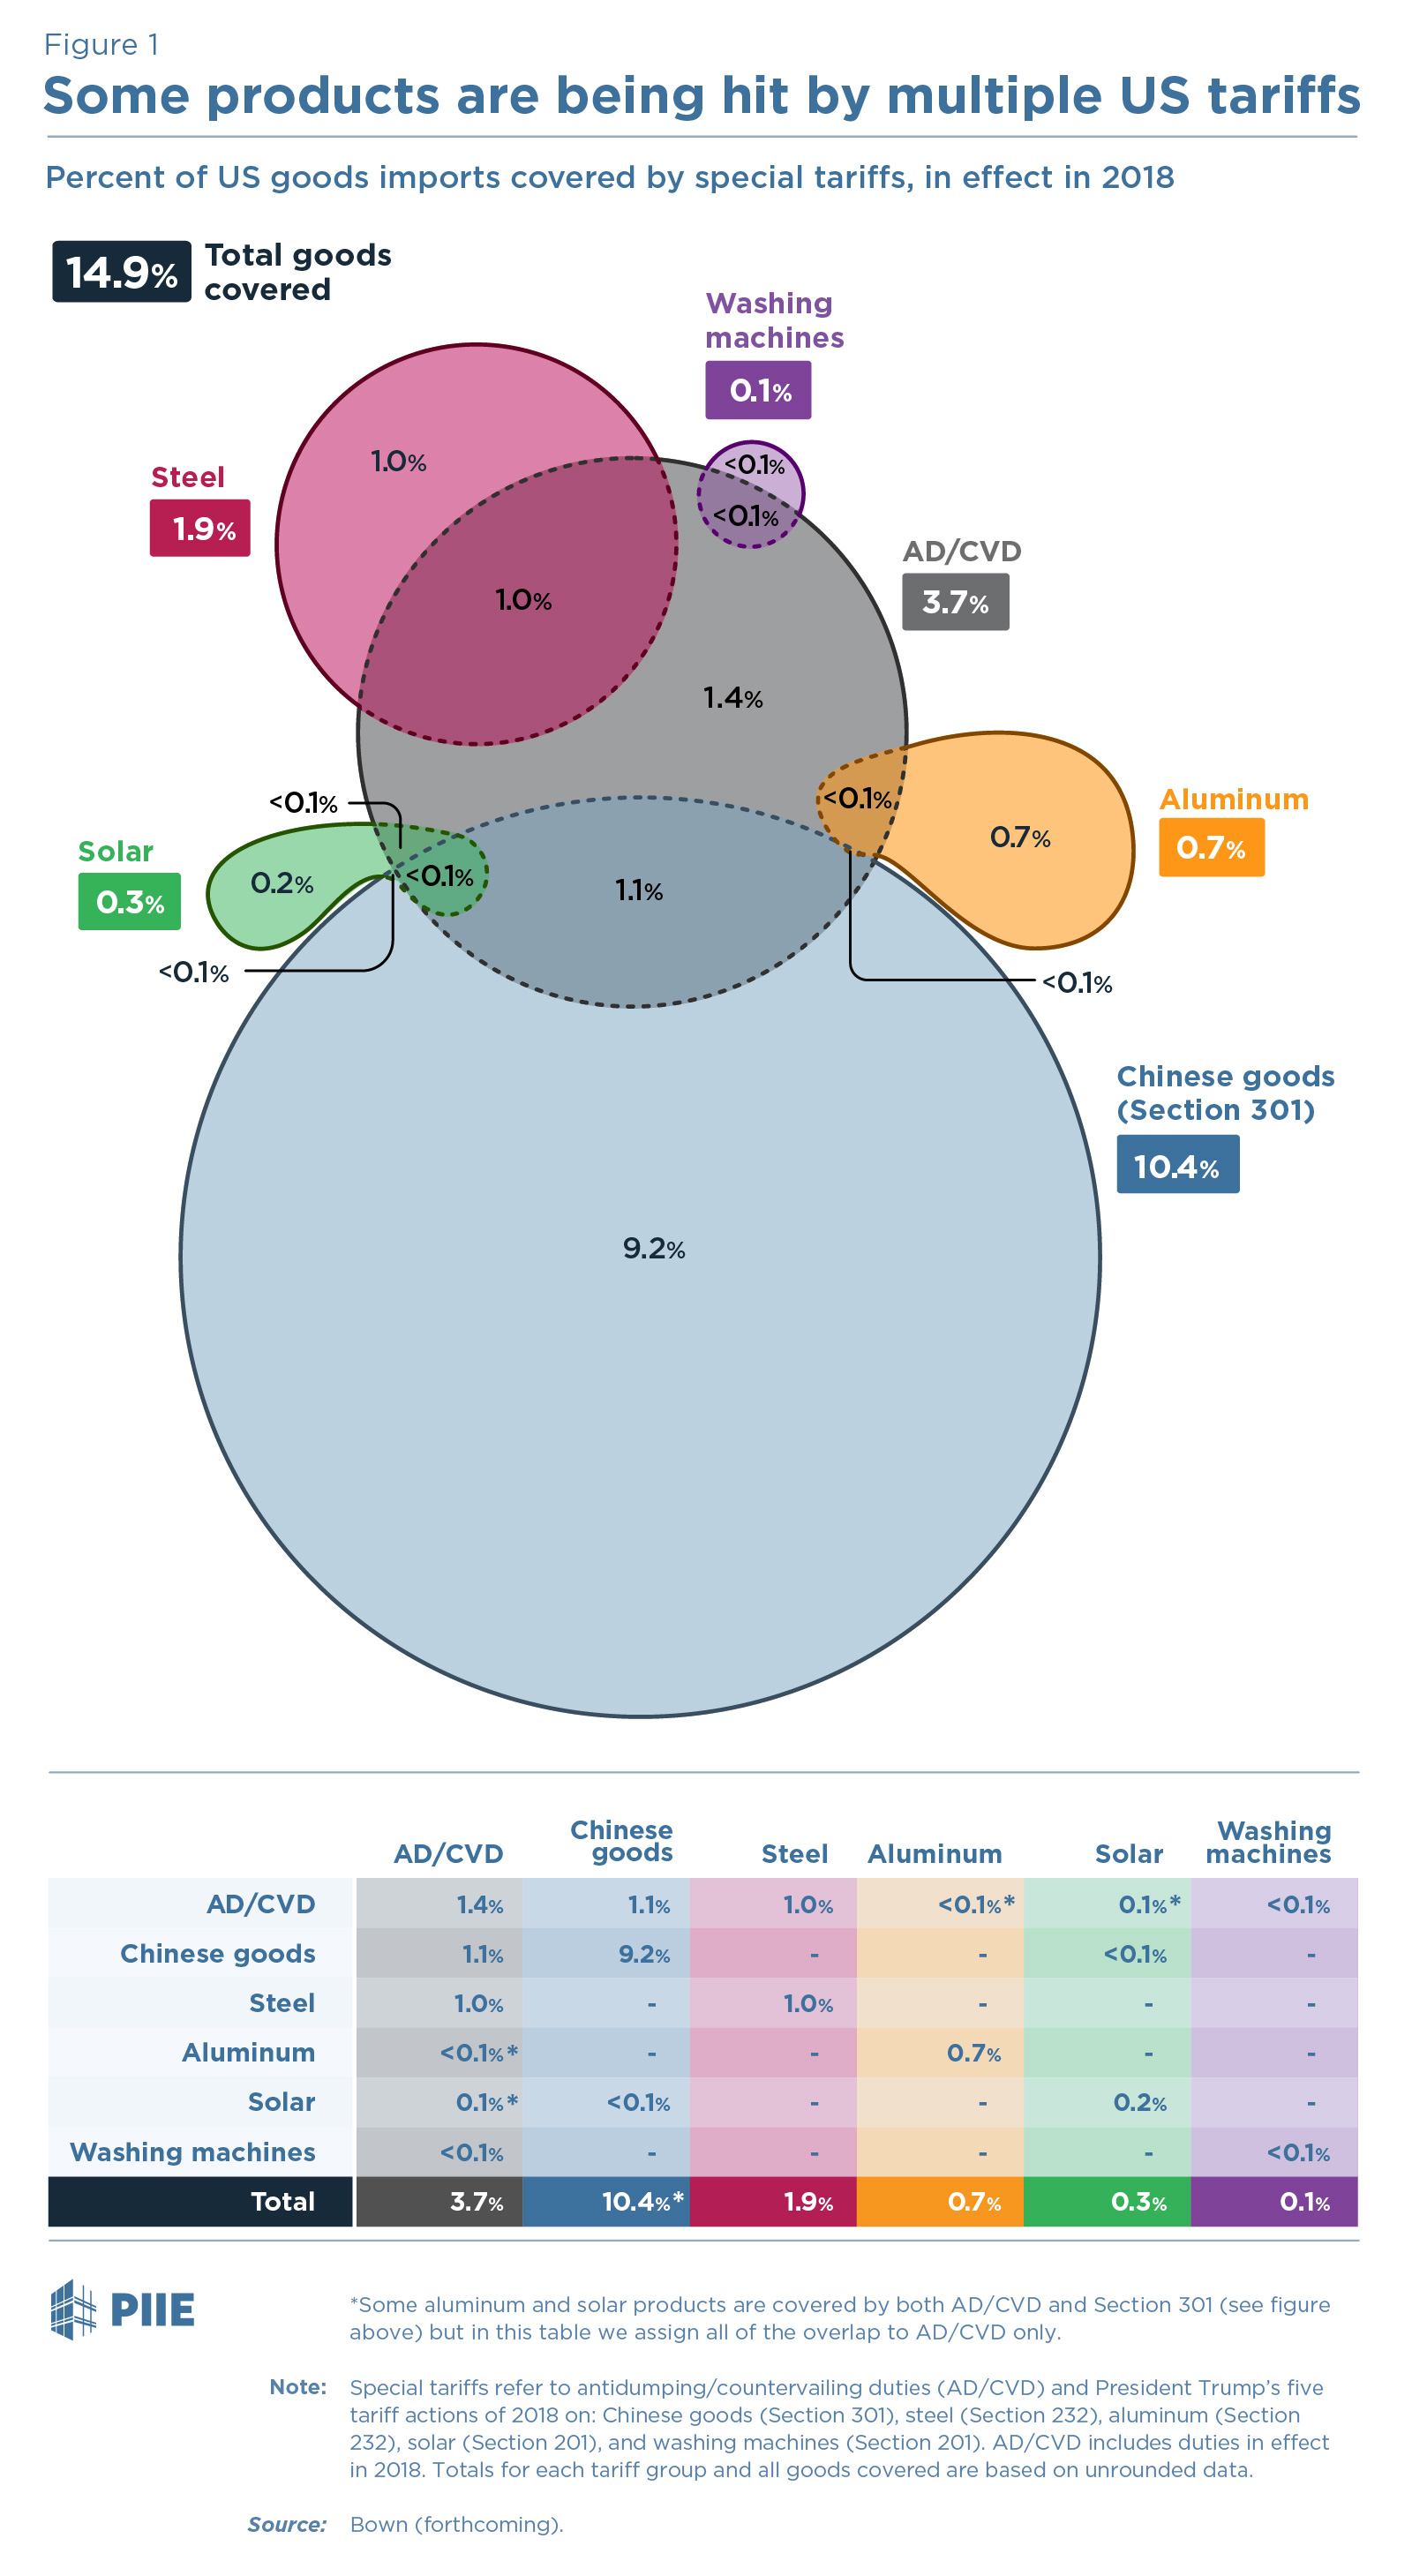
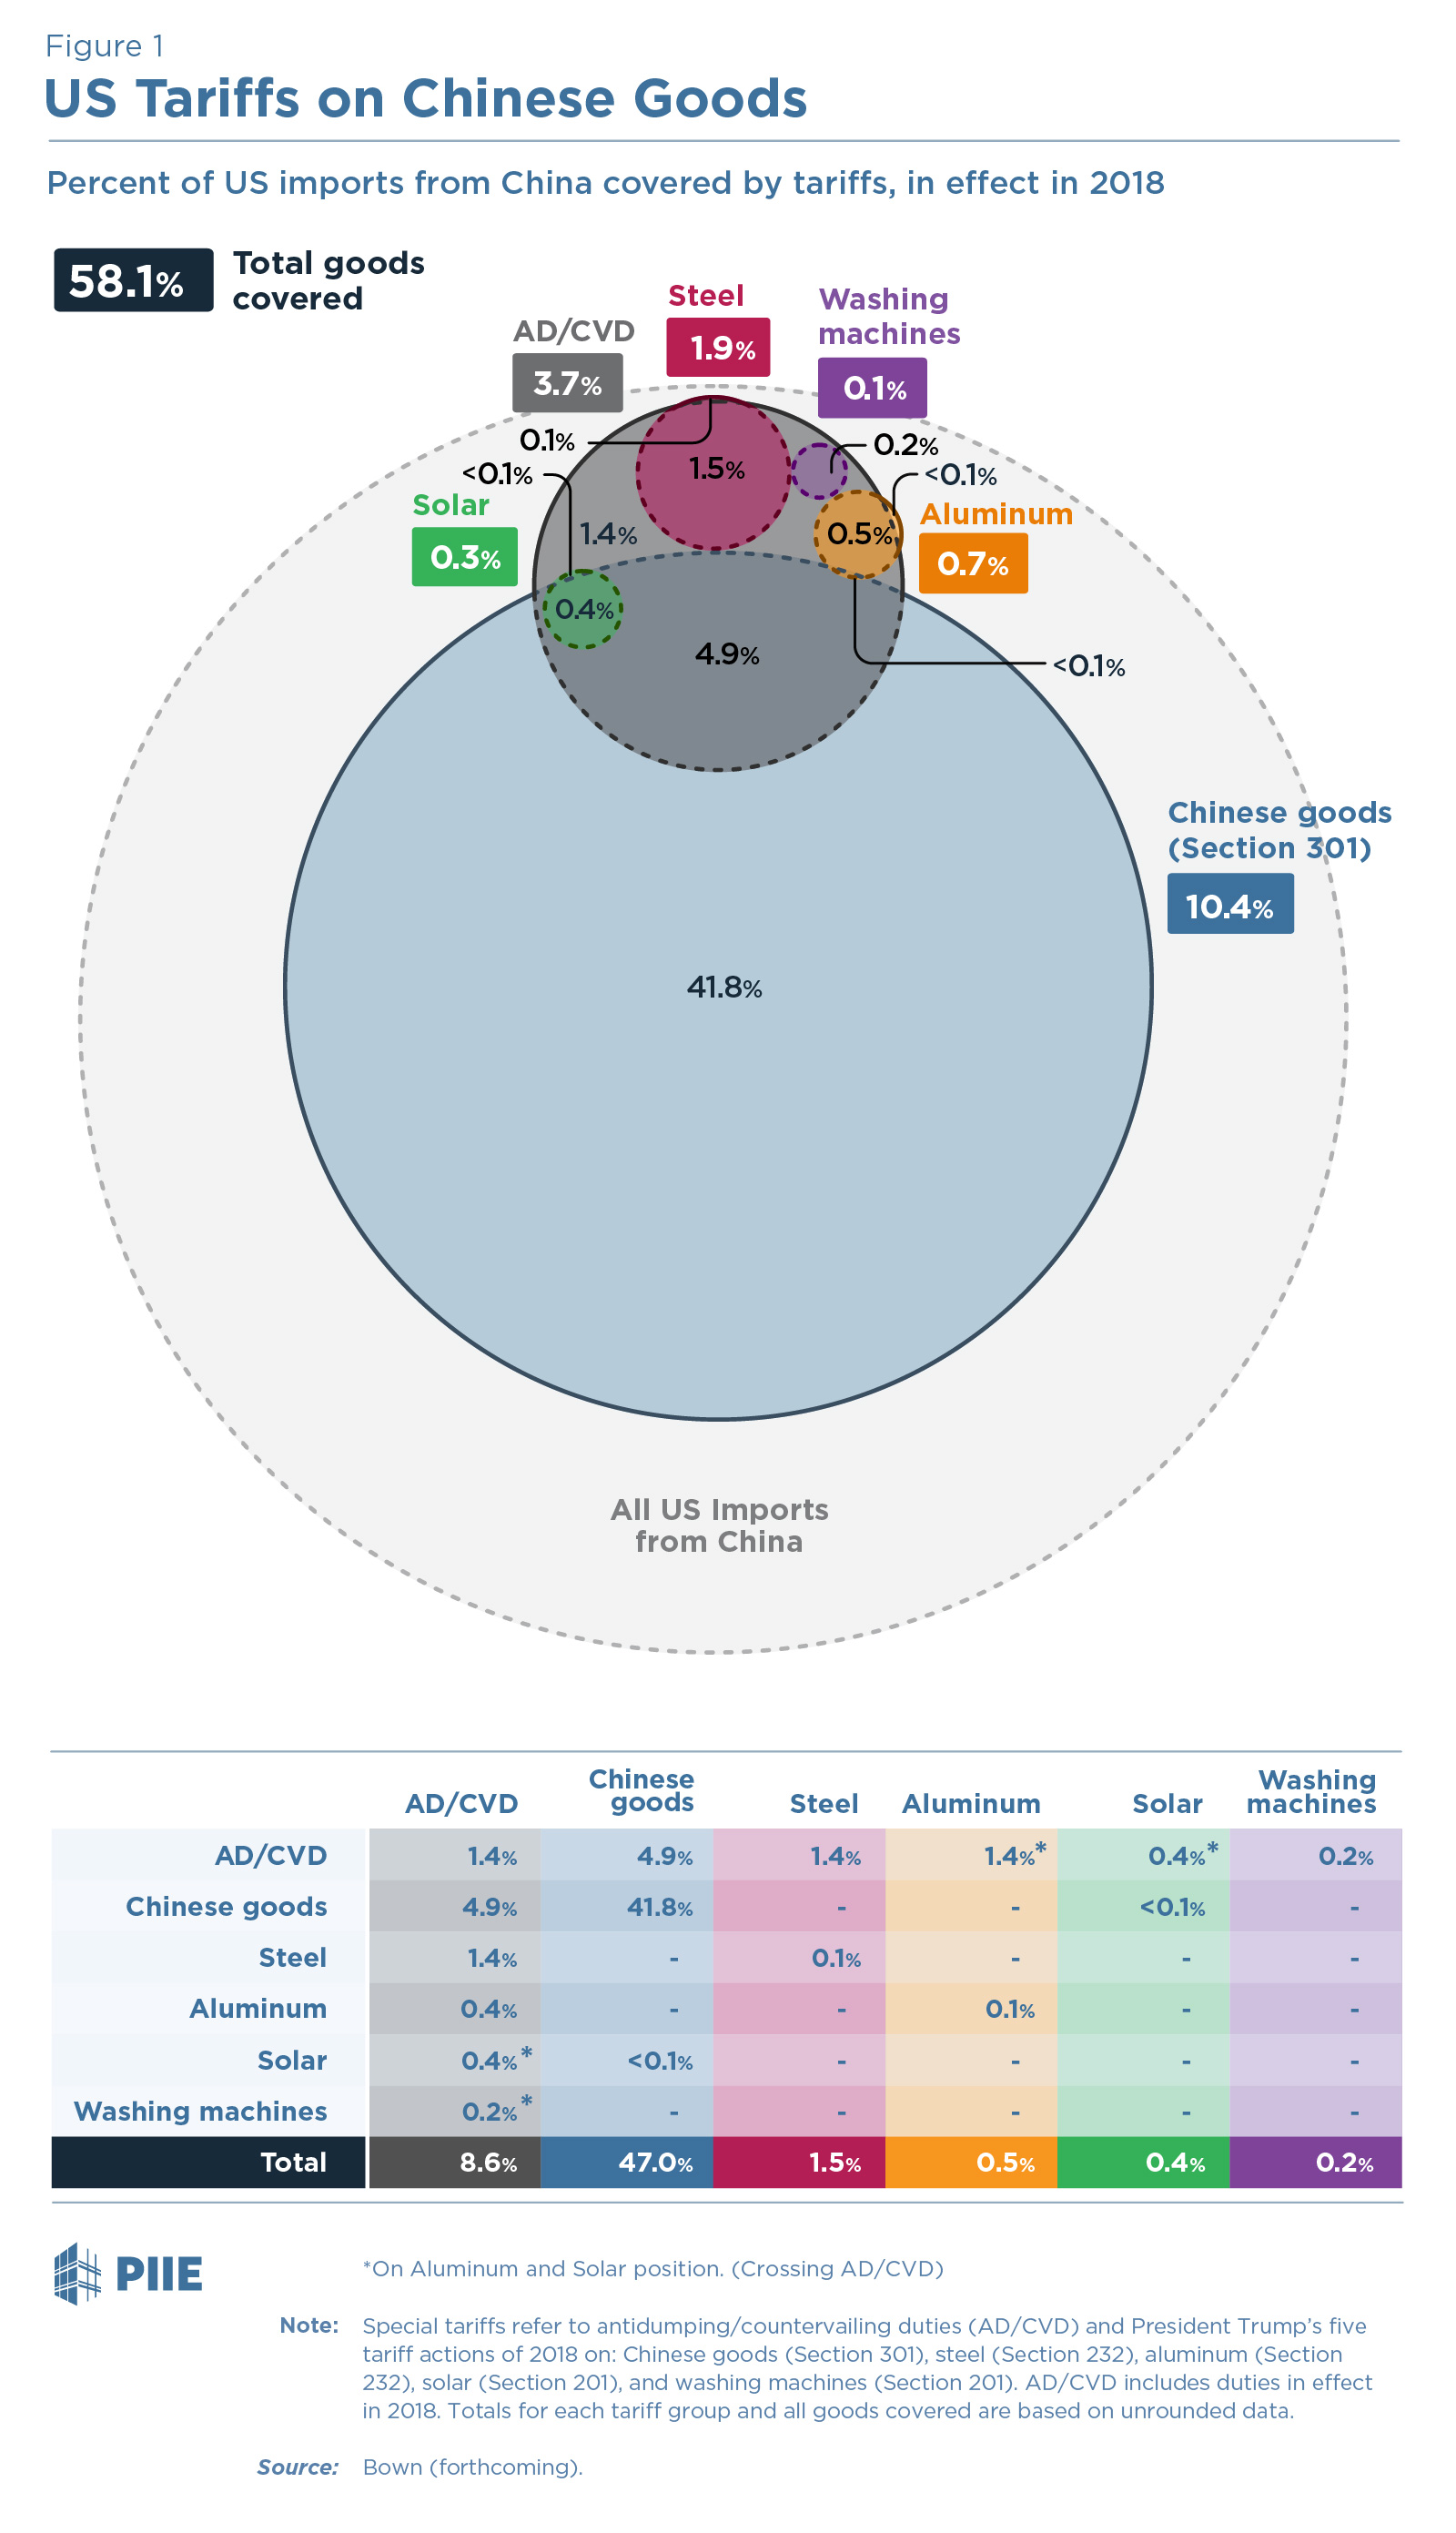
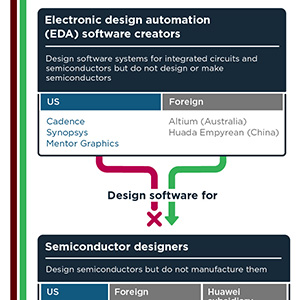
In 2018, the Trump administration undertook multiple trade actions against a variety of products and nations. These various trade actions hit some products multiple times, creating overlapping tariffs that were not apparent when taking the data at face value. Using very in depth research from Chad Bown and Eva Zhang, we created a venn diagram to illustrate the overlap of various trade actions and shed light on some of the less obvious consequences of protectionist policies by the Trump administration.
The Mission:
Produce a venn diagram and supporting graphic material to illustration the different trade actions of the Trump administration and how those actions overlapped with each other in the real world.
The Client:
Peterson Institute
The Time:
Late 2018 - Early 2019
My Role:
Concept Development, Graphic Design, Production
Other Credits
Steve Weisman: Creative Direction
Melina Kolb: Creative Direction
Melina Kolb: Creative Direction